Euler's Eyes
2026-10-19
From Oresme to the graph: drawing a quality that varies
A graph of speed against time looks like the most natural thing in the world. But think about what it does: it turns time into horizontal length and speed into vertical length, two quantities that are not lengths. It is a bold translation, and someone had to invent it.
Oresme’s latitudes
Around 1350, the Frenchman Nicole Oresme, a master in Paris and later bishop of Lisieux, wrote a treatise on the configurations of qualities. A quality, such as the heat of a bar or the speed of a body, can vary from one point to another or from one instant to another. Oresme proposed drawing it:
- the longitude, a horizontal line, represents the extension: the length of the bar or the duration of the motion;
- at each point, the latitude, a vertical segment, represents the intensity of the quality there.
Together the latitudes form a figure, and the shape of the figure describes the variation.
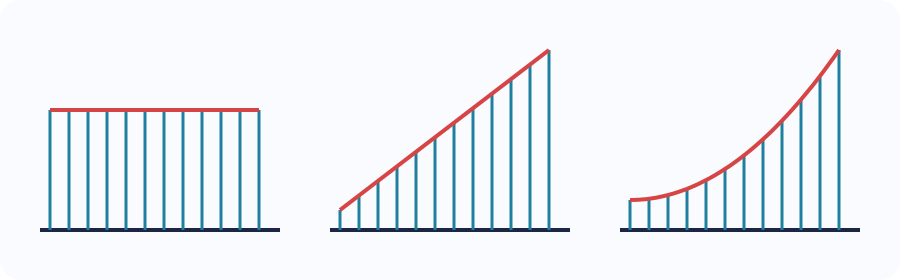
Oresme gave names to the three basic shapes. A uniform quality gives a rectangle. A uniformly difform one, which grows evenly, gives a triangle or a trapezium. A difformly difform one, which grows in any other way, gives a figure with a curved top. Today we would say: constant function, linear function and non-linear function.
A proof with areas
Oresme’s drawing was not just an illustration. With it, he proved a rule that scholars at Merton College, Oxford, had stated a few decades earlier: a body accelerating uniformly covers the same distance it would cover at a constant speed equal to the mean speed.
In the drawing, the distance is the area of the figure. Uniformly accelerated motion starting from rest is a triangle; motion at the mean speed is a rectangle with half the height. And the triangle and the rectangle have the same area, because the piece of the triangle sticking out above the rectangle equals the piece missing below. Two and a half centuries before Galileo, who would reach the same rule, the proof was a drawing.
The road to the graph
It would be natural to think that Descartes, who put geometry into equations in 1637, drew graphs like today’s. He did not. In Descartes’s book there are no two perpendicular axes with numbers marked on them, and negative coordinates are treated with suspicion. The word coordinates is Leibniz’s, from 1692. The graph of a function, with axes, scale and curve, took hold slowly over the eighteenth century, and graphs of data, like the ones in the next text, were only born in 1786.
Chapter 2 showed, with Raymond Duval, that moving from a formula to a graph is a conversion between registers, and that many students can calculate without being able to draw. Oresme’s story is a reminder that this conversion is not natural: it took centuries to invent.
Exercise: the mean speed rule
A car starts from rest and accelerates uniformly to $10$ m/s in $4$ s. How far does it travel?
In Oresme’s drawing, it is a triangle with base $4$ and height $10$: area $\frac{4\cdot10}{2}=20$ m. The mean speed is $5$ m/s, and $5\cdot4=20$ m: the rectangle of the mean speed has the same area.
Exercise: a trapezium
The speed grows uniformly from $2$ m/s to $8$ m/s in $3$ s. What distance is covered?
The figure is a trapezium with bases $2$ and $8$ and height $3$: area $\frac{(2+8)\cdot3}{2}=15$ m. It is the same as the mean speed, $5$ m/s, times $3$ s.
Chapter index · ← Euler’s circles and Venn diagrams · Charts that saved lives: Playfair, Snow, Nightingale and Minard →