
Euler's Eyes
2022-11-11
Introduction to Statistics
Statistics is one of the most applied areas of mathematics, with greater use in everyday life. For centuries, it was used unconsciously by people as a merely descriptive character and a record of occurrences.

The first uses
The first activities were around 2000 BC and were used in the census of Chinese agricultural populations.

At the beginning of the 19th century, great mathematicians entered the scene, for example, the Frenchman Simon Laplace and the German Carl Friedrich Gauss (1777 –1855). The latter arises with applications of the “normal distribution” for modeling measurement errors.
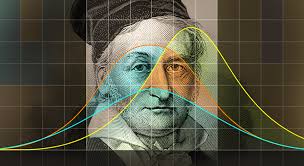
The theory of normal distribution was used by the Belgian astronomer and mathematician Adolphe Quételet (1796 – 1874), in the statistical study of several characteristics of human populations:
- height,
- weight,
- birth,
- mortality,
- monthly income
- among others.

Ronald Aylmer Fisher (1890 – 1962), British statistician, was the genius who created the modern theory of statistics.
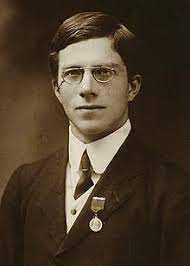
Fisher used the results he obtained in Statistics as tools for application in his genetic studies, and today he is considered one of the biggest names in Statistical Theory and Statistics applied to Biology.
Current use
The term dice comes from game theory, which uses dice in some types of games. The collection of this information went down in history as data.

In statistics there are some basic elements for data analysis. The starting point for analyzing this information is called descriptive statistics. Descriptive statistics are used to organize, summarize and describe the behavior of data.

The descriptive tools used in descriptive statistics are in the form of graphs and tables. The tables describe summary measures such as:
- position measurements,
- dispersion measures.
The election is an example of position measures (percentage of votes) and dispersion measures (margin of “error”), which in statistics we call confidence intervals.

Whenever we summarize a set of data, we lose information about it, as we condense the original observations. However, this loss of information is small compared to the gain from the clarity of interpretation provided.
Variability
Statistics uses the variability present in the data. The objective is to obtain such information about the behavior of processes and products.

Variability is present everywhere, like the position of a car parked in a garage is not the same across days.

In this case, the position of the car varies. Our strategy consists of evaluating variations and obtaining information through them.
This is a small introduction, wait for the next posts.