Euler's Eyes
2026-09-26
ENEM 2021 – Solved mathematics: questions 151 to 165
Source: INEP – proof and template of the 2nd day, Notebook 5 – Yellow (1st application).
The ENEM Mathematics and Technologies test 2021 was administered on the 2nd day and will from question 136 to 180. This post addresses questions 151 to 165. The numbering used here is that of the Notebook 5 – Yellow; us In other notebooks the same questions appear in a different order.
Template
| Question | Subject | Template |
|---|---|---|
| 151 | Fuel performance (km/L) | D |
| 152 | Areas of a parallelepiped | B |
| 153 | Cylinder volume | D |
| 154 | Graph of piecewise defined function | A |
| 155 | Quadratic function with integer domain | E |
| 156 | Matrices: reading the elements | E |
| 157 | Successive percentage changes | B |
| 158 | Inversely proportional quantities | A |
| 159 | Optimization: lower cost | D |
| 160 | Percentage: quantity reduction | C |
| 161 | Trigonometric function: spring movement | A |
| 162 | Definite operations and 2nd degree equation | E |
| 163 | Scale | C |
| 164 | Projection and ratio per thousand inhabitants | D |
| 165 | Chart Reading: Monthly Profit | B |
Question 151: Performance of the new engine
Statement
A car has an average performance of 16 km/L. An engineer developed a new combustion engine that saves, in relation to fuel consumption, previous engine, 0,1 L of fuel for every 20 km travelled.
The average performance value of the car with the new engine, in kilometers per liter, expressed to one decimal place, is
- A) 15,9.
- B) 16,1.
- C) 16,4.
- D) 17,4.
- E) 18,0.
Resolution
1. Old consumption in 20 km. With 16 km/L, to run 20 km the old engine spent
$$\frac{20}{16} = 1{,}25 \text{ L}$$2. New consumption in 20 km. The new engine saves 0,1 L in this section:
$$1{,}25 - 0{,}1 = 1{,}15 \text{ L}$$3. New performance(kilometers per liter):
$$\frac{20}{1{,}15} \approx 17{,}39 \approx 17{,}4 \text{ km/L}$$Answer: alternative D (17,4 km/L).
Be careful with the catch: the new engine uses less fuel, so performance (km/L) has to increase. This already eliminates alternative A.
To review, see Fees.
Question 152: Paint for the container with double dimensions
Statement
The design of a container, in the shape of a straight rectangular parallelepiped, provided for the painting on both sides (internal and external) of each of the four walls with acrylic paint and painting the internal floor with epoxy paint. The builder had requested, from five different suppliers, quotes for the necessary paints, but, Before starting the work, he decided to change the original project, changing the length and width to double that originally predicted, maintaining height unchanged. When asking suppliers for new quotes for new dimensions, each gave a different answer about the new amounts of paint required.
In relation to what was foreseen for the original project, the new quantities of paint Requirements reported by suppliers were as follows:
- Supplier I: “Double as much for both the walls and the floor.”
- Supplier II: “Double for the walls and four times for the floor.”
- Supplier III: “Four times for both the walls and the floor.”
- Supplier IV: “Four times for the walls and twice as much for the floor.”
- Supplier V: “Eight times for the walls and four times for the floor.”
Analyzing information from suppliers, the builder will provide the adequate amount of material. Consider the container access port as part of one of the walls.
Which of the suppliers provided the appropriate information should be chosen? by the builder to purchase the material?
- A) I
- B) II
- C) III
- D) IV
- E) V
Resolution
The amount of paint is proportional to the area painted. Let $c$, $\ell$ and $h$ the original length, width, and height.
1. Walls. The four walls are two rectangles $c \times h$ and two $\ell \times h$ (and each one is painted on both sides, which only multiplies everything by 2):
$$A_{\text{paredes}} = 2 \cdot (2ch + 2\ell h) = 4h(c + \ell)$$With $c$ and $\ell$ doubled and $h$ equal:
$$4h(2c + 2\ell) = 2 \cdot 4h(c + \ell)$$The area of the walls doubles.
2. Floor. The area is $c \cdot \ell$. With both measurements doubled:
$$(2c)(2\ell) = 4c\ell$$The floor area becomes four times larger.
Answer: alternative B (Supplier II).
Be careful with the catch: “double the measurements, double everything” (Supplier I) is wrong. The floor area depends on two measurements that have doubled, so multiplies by $2 \cdot 2 = 4$. On the walls, only one of the two measurements each rectangle doubled (the height stayed the same), so they only doubled.
To review, see Proportions and Geometry.
Question 153: Height of the cylindrical reservoir
Statement
A village with 100 inhabitants is experiencing a prolonged drought and those responsible for local public administration decide to hire the construction of a reservoir. It should be in the shape of a circular cylinder straight, whose base has 5 meters in internal diameter, and meets the water demand of the population for a period of exactly seven consecutive days. In the eighth day, the empty reservoir is completely refilled by water trucks.
Consider that the average daily consumption per inhabitant is 120 liters of water. Use 3 as an approximation for $\pi$.
Under the conditions presented, the reservoir must be built with a height minimum internal area, in meters, equal to
- A) 1,12.
- B) 3,10.
- C) 4,35.
- D) 4,48.
- E) 5,60.
Resolution
1. Required volume. 100 inhabitants, 120 liters per day each, during 7 days:
$$100 \cdot 120 \cdot 7 = 84\thinspace 000 \text{ L} = 84 \text{ m}^3$$(remembering that 1 m³ = 1 000 L).
2. Base area. The diameter is 5 m, then the radius is 2,5 m:
$$A_{\text{base}} = \pi r^2 = 3 \cdot 2{,}5^2 = 3 \cdot 6{,}25 = 18{,}75 \text{ m}^2$$3. Height. The volume of the cylinder is base area × height:
$$18{,}75 \cdot h = 84 \quad\Rightarrow\quad h = \frac{84}{18{,}75} = 4{,}48 \text{ m}$$Answer: alternative D (4,48 m).
Be careful with the trick: using the diameter (5 m) as if it were the radius gives area $3 \cdot 25 = 75$ m² and height $\frac{84}{75} = 1{,}12$ m (alternative A).
To review, see Circle Area.
Question 154: Graph of tax due
Statement
The table represents the relationship between the price of a product ($R$) and its respective tax due ($I$).
| Product Price ($R$) | Tax due ($I$) |
|---|---|
| $R \le 5\thinspace 000$ | free |
| $5\thinspace 000 < R \le 10\thinspace 000$ | 10% of $(R - 5\thinspace 000)$ |
| $10\thinspace 000 < R \le 15\thinspace 000$ | $500 + 30\%$ from $(R - 10\thinspace 000)$ |
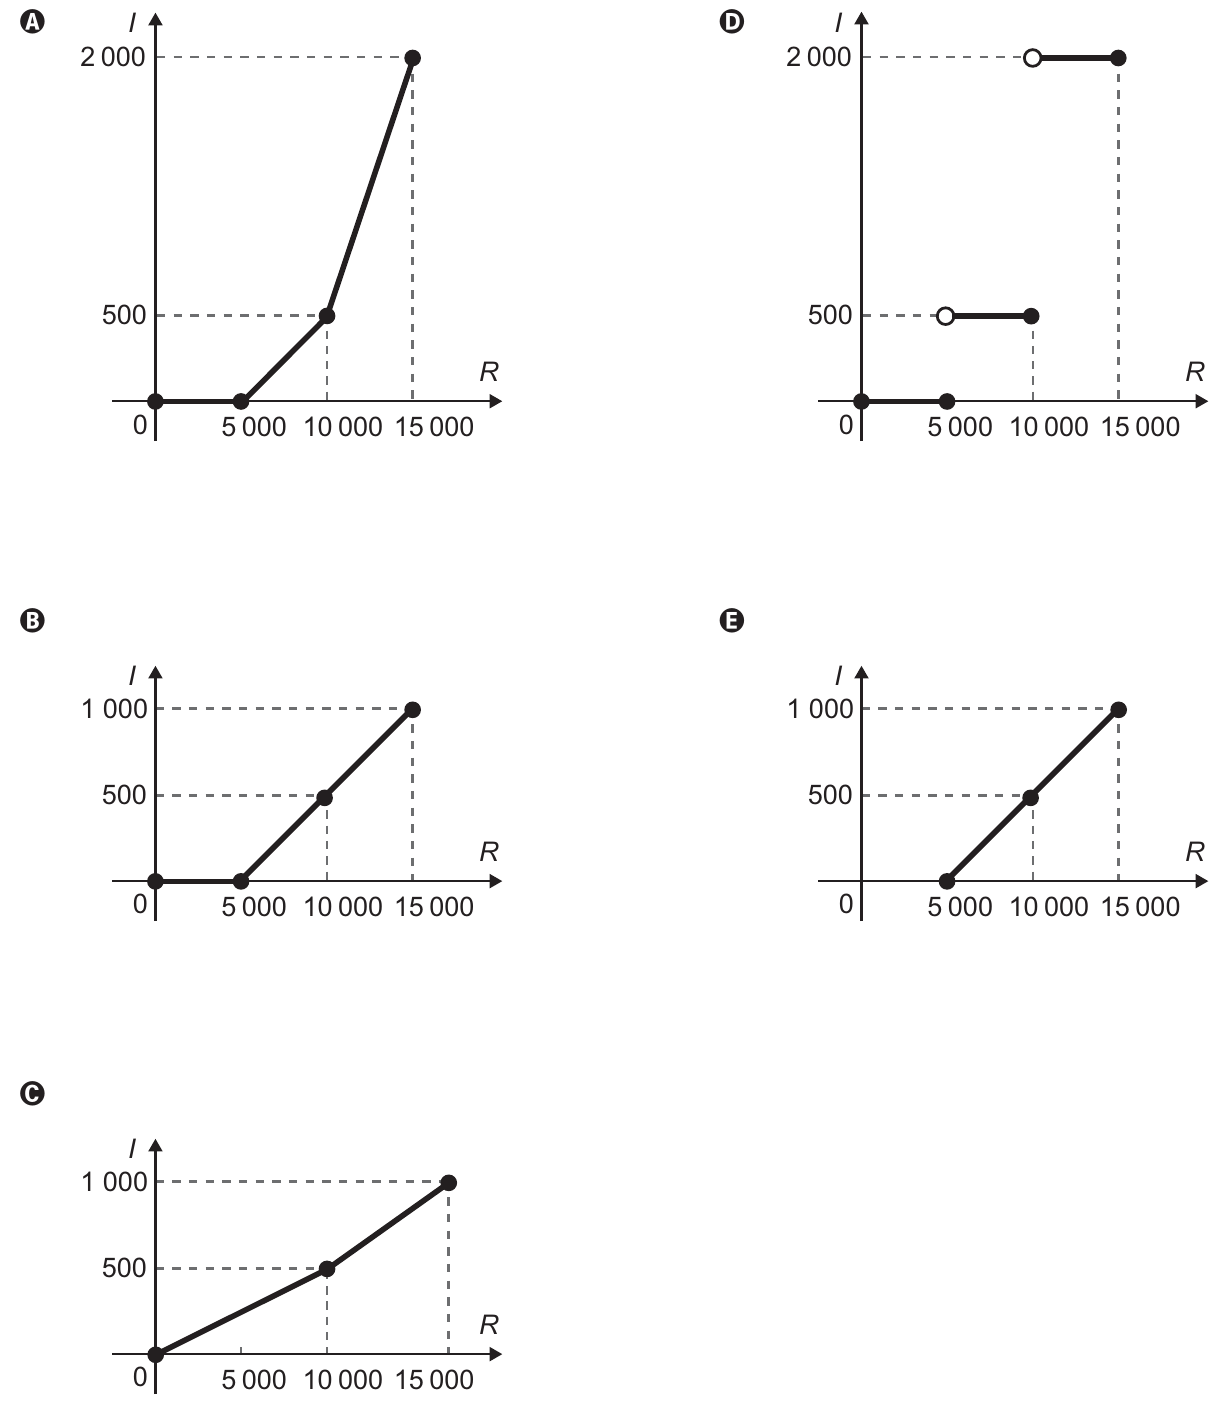
The graph that best represents this relationship is
Resolution
We will calculate the tax at the points where the rule changes.
1. Until 5 000: exempt, then $I = 0$. The graph starts with a segment horizontal about the axis, from 0 to 5 000.
2. From 5 000 to 10 000: $I = 0{,}1 \cdot (R - 5\thinspace 000)$, an affine function.
- in $R = 5\thinspace 000$: $I = 0$ (the graph does not jump);
- in $R = 10\thinspace 000$: $I = 0{,}1 \cdot 5\thinspace 000 = 500$.
It is a straight line segment from $(5\thinspace 000;\ 0)$ to $(10\thinspace 000;\ 500)$.
3. From 10,000 to 15,000: $I = 500 + 0{,}3 \cdot (R - 10\thinspace 000)$.
- just after 10 000, the tax is close to 500 (again without a jump);
- in $R = 15\thinspace 000$: $I = 500 + 0{,}3 \cdot 5\thinspace 000 = 500 + 1\thinspace 500 = 2\thinspace 000$.
It is a segment from $(10\thinspace 000;\ 500)$ to $(15\thinspace 000;\ 2\thinspace 000)$, steeper than the previous one (rate of 30% against 10%).
4. Compare with graphs. The only one that passes through $(5\thinspace 000;\ 0)$, $(10\thinspace 000;\ 500)$ and $(15\thinspace 000;\ 2\thinspace 000)$, without jumps, is the alternative A.
Answer: alternative A.
Be careful with the catch: chart B ends in 1 000, which is what obtained by applying 10% also to the last track. Chart D has “steps”, like if the tax were constant in each bracket.
To review, see First Degree Functions.
Question 155: Theater revenue due to the discount
Statement
The administrator of a theater realized that, with the entry of the event, R$ 20,00, a show managed to attract 200 people and that, for every R$ 1,00 of reduction in ticket price, the number of people increased by 40. He knows that the theater owners only admit to working with integer values for the tickets, due to the difficulty of making change available, and intends to convince them to lower the ticket price. Thus, it will present a graph of the collection in function of the value of the discount on the current ticket price.
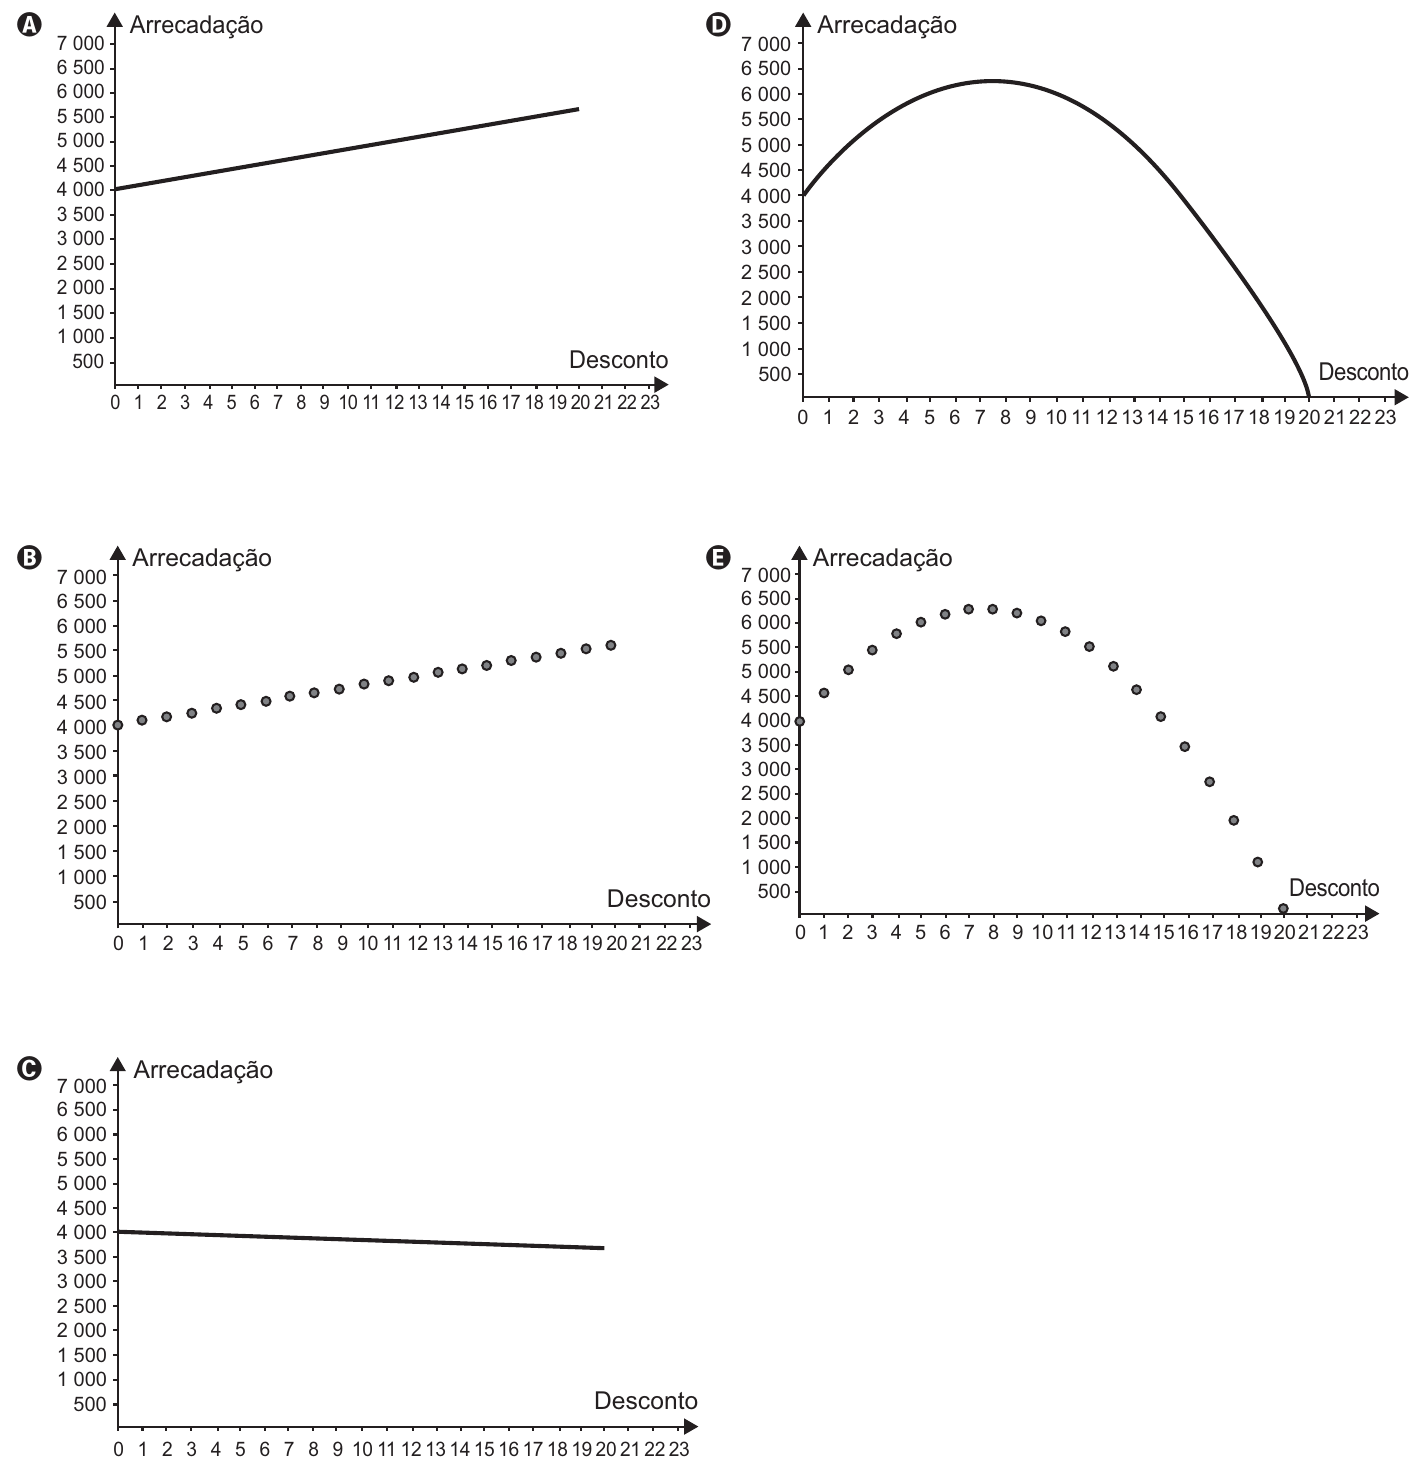
The graph that most closely resembles what should be drawn up by the administrator is
Resolution
1. Assemble the function. With a discount of $x$ reais:
- ticket price: $20 - x$;
- public: $200 + 40x$.
The collection is price × public:
$$A(x) = (20 - x)(200 + 40x)$$2. What kind of function is this? Multiplying:
$$A(x) = 4\thinspace 000 + 800x - 200x - 40x^2 = -40x^2 + 600x + 4\thinspace 000$$It is a function of 2nd degree with a negative $x^2$ coefficient: the graph is a parabola with the concavity downwards. This eliminates A, B and C (which are straight lines or aligned points).
3. Some values:
- $A(0) = 20 \cdot 200 = 4\thinspace 000$ (chart starts at 4 000);
- the roots are $x = 20$ and $x = -5$, so the vertex is at $x = \frac{20 + (-5)}{2} = 7{,}5$;
- $A(7) = 13 \cdot 480 = 6\thinspace 240$ and $A(8) = 12 \cdot 520 = 6\thinspace 240$ (maximum among integers);
- $A(20) = 0$ (free ticket).
4. Points or curve? Owners only accept whole prices, so the discount $x$ can only be 0, 1, 2, …, 20. The graph is made up of points isolatedon the parabola, not by a continuous curve. It’s graph E.
Answer: alternative E.
Be careful with the catch: graph D has the right shape, but it is a continuous curve, which would allow discounts such as R$ 7,50. The statement warns which are only valid integer values.
To review, see 2th degree equation.
Question 156: Region of destination of the largest flow (matrix)
Statement
A construction company, intending to invest in the construction of properties in a metropolis with five large regions, carried out a survey on the number of families that moved from one region to another in order to determine which region was the destination of the largest flow of families, without taking into account the number of families that left the region. The search values are arranged in an array $A = [a_{ij}]$, $i, j \in \\{1, 2, 3, 4, 5\\}$, where the element $a_{ij}$ corresponds to the total number of families (in dozens) that moved from region $i$ to the region $j$ during a certain period, and the element $a_{ii}$ is considered null, since only changes between different regions are considered. Next, The matrix with the research data is presented.
Which region was selected for the construction company’s investment?
- A) 1
- B) 2
- C) 3
- D) 4
- E) 5
Resolution
1. Where is the destination? In element $a_{ij}$, index $i$ (row) is the source region and the index $j$ (column) is the destination region. So all families that arrived in region $j$ are in column $j$.
2. Add each column:
| Destination region $j$ | Column Sum | Total |
|---|---|---|
| 1 | $0 + 0 + 2 + 1 + 1$ | 4 |
| 2 | $4 + 0 + 2 + 0 + 2$ | 8 |
| 3 | $2 + 6 + 0 + 2 + 0$ | 10 |
| 4 | $2 + 2 + 3 + 0 + 4$ | 11 |
| 5 | $5 + 3 + 0 + 4 + 0$ | 12 |
The region 5 received 12 dozens of families (120 families), the largest flow of arrival.
Answer: alternative E (region 5).
Be careful with the catch: adding the lines counts the families that left each region. The line 1 has the largest sum (13), and this leads to alternative A, precisely what the statement says not to consider.
Question 157: Consumption of aircraft B in relation to A
Statement
To make a flight between two cities that are 2 000 km away from each other, a airline used an aircraft model A, capable of transporting up to 200 passengers. When one of these aircraft is full of passengers, consumption of fuel is 0,02 liter per kilometer and per passenger. This company decided to exchange aircraft model A for aircraft model B, which is capable of carrying 10% more passengers than model A, but consuming 10% less fuel per kilometer and per passenger.
The amount of fuel consumed by aircraft model B, in relation to that of aircraft model A, on a crowded flight between the two cities, is
- A) 10% lower.
- B) 1% lower.
- C) the same.
- D) 1% higher.
- E) 11% higher.
Resolution
The total consumption is
$$\text{consumo} = (\text{litros por km por passageiro}) \times (\text{passageiros}) \times (\text{km})$$1. Aircraft A:
$$0{,}02 \cdot 200 \cdot 2\thinspace 000 = 8\thinspace 000 \text{ L}$$2. Aircraft B. Passengers: $200 \cdot 1{,}1 = 220$. Consumption per km and per passenger: $0{,}02 \cdot 0{,}9 = 0{,}018$ L.
$$0{,}018 \cdot 220 \cdot 2\thinspace 000 = 7\thinspace 920 \text{ L}$$3. Compare:
$$\frac{7\thinspace 920}{8\thinspace 000} = 0{,}99$$B’s consumption is 99% of A’s, that is, 1% lower.
Faster: factors multiply, $1{,}1 \cdot 0{,}9 = 0{,}99$.
Answer: alternative B (1% smaller).
Be careful with the catch: “+10% and −10% cancel each other out” (alternative C) is wrong. Successive percentages multiply: $1{,}1 \cdot 0{,}9 = 0{,}99$, not 1.
To review, see Increases and Discounts.
Question 158: Changing tires with a small group
Statement
In an automobile race, cars may make pit stops to perform tire changes. In these exchanges, the work is done by a group of three people on each tire. Consider that the groups start working on the same instantly, they work at the same speed and each group works on a single tire. With the four groups complete, it takes 4 seconds for the change to take place. carried out. The time taken by a group to change a tire is inversely proportional to the number of people working on it. At one of these stops, a of the workers fell ill, was unable to participate in the exchange and was not replaced, so that one of the four exchange groups was reduced.
At this specific stop, with one of the groups reduced, what was the time spent, in second, to change the four tires?
- A) 6,0
- B) 5,7
- C) 5,0
- D) 4,5
- E) 4,4
Resolution
1. The complete groups. Three groups continue with 3 people and exchange their tires in 4 seconds.
2. The group was reduced. It was left with 2 people. Time and number of people are inversely proportional, so the product (people × time) is constant:
$$3 \cdot 4 = 2 \cdot t \quad\Rightarrow\quad t = 6 \text{ segundos}$$3. Total time. The four groups start together, and the exchange only ends when the last tire is ready. This happens in 6 seconds.
Answer: alternative A (6,0 seconds).
Be careful with the catch: there is no need to average between groups. You tires are changed at the same time, and who defines the total time is the fastest group slow.
To review, see Quantity Analysis.
Question 159: Cheapest supplement
Statement
A nutritionist verified, in his client’s daily diet, the lack of 800 mg of mineral A, 1 000 mg of mineral B and 1 200 mg of mineral C. Therefore, recommended the purchase of dietary supplements that provide minerals missing and informed that there would be no problem if he consumed more of these minerals than recommended.
The customer found five supplements, sold in single sachets, whose Prices and quantities of minerals are presented below:
- Supplement I: contains 50 mg of mineral A, 100 mg of mineral B and 200 mg of mineral C and costs R$ 2,00;
- Supplement II: contains 800 mg of mineral A, 250 mg of mineral B and 200 mg of mineral C and costs R$ 3,00;
- Supplement III: contains 250 mg of mineral A, 1 000 mg of mineral B and 300 mg of mineral C and costs R$ 5,00;
- Supplement IV: contains 600 mg of mineral A, 500 mg of mineral B and 1 000 mg of mineral C and costs R$ 6,00;
- Supplement V: contains 400 mg of mineral A, 800 mg of mineral B and 1 200 mg of mineral C and costs R$ 8,00.
The customer decided to buy sachets of a single supplement on which he would spend less money and also make up for the lack of minerals indicated by the nutritionist, even if he consumed some of them beyond his need.
Under these conditions, the customer must purchase sachets of the supplement
- A) I.
- B) II.
- C) III.
- D) IV.
- E) V.
Resolution
For each supplement, we calculate how many sachets are needed to cover each mineral (rounding up, because you don’t buy half a sachet). O number of sachets to purchase is the largest of these three values, so that none mineral is missing.
| Supplement | Mineral A (800) | Mineral B (1 000) | Mineral C (1 200) | Sachets | Cost |
|---|---|---|---|---|---|
| I | 800/50 = 16 | 1000/100 = 10 | 1200/200 = 6 | 16 | 16 · 2 = R$ 32,00 |
| II | 800/800 = 1 | 1000/250 = 4 | 1200/200 = 6 | 6 | 6 · 3 = R$ 18,00 |
| III | 800/250 = 3,2 → 4 | 1000/1000 = 1 | 1200/300 = 4 | 4 | 4 · 5 = R$ 20,00 |
| IV | 800/600 ≈ 1,3 → 2 | 1000/500 = 2 | 1200/1000 = 1,2 → 2 | 2 | 2 · 6 = R$ 12,00 |
| V | 800/400 = 2 | 1000/800 = 1,25 → 2 | 1200/1200 = 1 | 2 | 2 · 8 = R$ 16,00 |
The lowest cost is R$ 12,00, with 2 IV supplement sachets.
Answer: alternative D (supplement IV).
Be careful with the catch: the cheapest sachet (supplement I, R$ 2,00) It requires 16 units and is the most expensive in total. What matters is the total cost, not the price of each sachet.
Question 160: Percentage reduction of chicken
Statement
An athlete produces his own meal with a fixed cost of R$ 10,00. She is consisting of 400 g of chicken, 600 g of sweet potato and a vegetable. Currently, The prices of products for this meal are:
| Chicken (kg) | Sweet potato (kg) | Vegetables (unit) | |
|---|---|---|---|
| Meal | R$ 12,50 | R$ 5,00 | R$ 2,00 |
In relation to these prices, there will be an increase of 50% in the price of a kilogram of sweet potato, and other prices will not change. The athlete wants to maintain the cost of the meal, the quantity of sweet potatoes and vegetables. Therefore, you will have to reduce the amount of chicken.
What percentage reduction in the amount of chicken should be so that the athlete achieve your goal?
- A) 12,5
- B) 28,0
- C) 30,0
- D) 50,0
- E) 70,0
Resolution
1. Current cost (checking R$ 10,00):
- chicken: $0{,}4 \cdot 12{,}50 = 5{,}00$;
- sweet potato: $0{,}6 \cdot 5{,}00 = 3{,}00$;
- vegetable: $2{,}00$.
Total: R$ 10,00.
2. New sweet potato price: $5{,}00 \cdot 1{,}5 = 7{,}50$ per kg. The 600 g start to cost $0{,}6 \cdot 7{,}50 = 4{,}50$.
3. How much is left for the chicken:
$$10{,}00 - 4{,}50 - 2{,}00 = 3{,}50 \text{ reais}$$With chicken at R$ 12,50 per kg:
$$\frac{3{,}50}{12{,}50} = 0{,}28 \text{ kg} = 280 \text{ g}$$4. Percentage reduction. The chicken goes from 400 g to 280 g, a reduction of 120 g:
$$\frac{120}{400} = 0{,}30 = 30\%$$Answer: alternative C (30%).
Be careful with the catch: 70% (alternative E) is how much is left chicken ($280/400$), not how much it was reduced. And 28 (alternative B) comes from confusing the new quantity of chicken, 0,28 kg, with the requested percentage.
To review, see Percentage Basics.
Question 161: Position of the mass attached to the spring (trigonometric function)
Statement
A spring is released from the extended position as shown in the figure. The figure on the right represents the graph of the position $P$ (in cm) of the mass $m$ as a function of time $t$ (second) in a Cartesian coordinate system. This periodic movement is described by an expression of the type $P(t) = \pm A \cos(\omega t)$ or $P(t) = \pm A \operatorname{sen}(\omega t)$, where $A > 0$ is the amplitude of maximum displacement and $\omega$ is the frequency, which relates to the period $T$ by the formula $\omega = \frac{2\pi}{T}$.
Consider the absence of any dissipative forces.
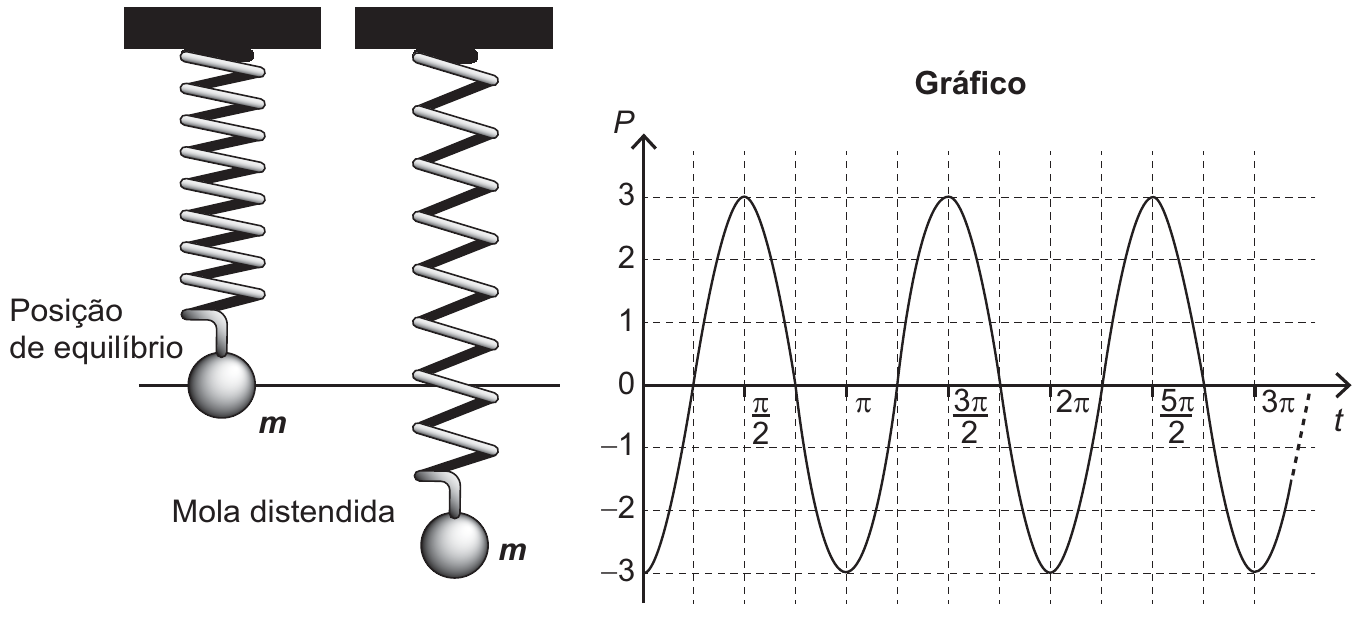
The algebraic expression that represents the positions $P(t)$ of the mass $m$, along of time, on the graph, is
- A) $-3\cos(2t)$
- B) $-3\operatorname{sen}(2t)$
- C) $3\cos(2t)$
- D) $-6\cos(2t)$
- E) $6\operatorname{sen}(2t)$
Resolution
1. Amplitude. The graph oscillates between $-3$ and $3$, then $A = 3$.
2. Period. The first maximum is at $t = \frac{\pi}{2}$ and the next at $t = \frac{3\pi}{2}$. The distance between two consecutive highs is the period:
$$T = \frac{3\pi}{2} - \frac{\pi}{2} = \pi \quad\Rightarrow\quad \omega = \frac{2\pi}{T} = \frac{2\pi}{\pi} = 2$$3. Sine or cosine, with what sign? We look at the starting point: in $t = 0$ the graph is at $P = -3$ (the spring starts stretched, at the lowest point).
- $\operatorname{sen}(0) = 0$, then expressions with sine would give $P(0) = 0$: discarded;
- $\cos(0) = 1$, then $3\cos(2t)$ gives $P(0) = 3$ (wrong) and $-3\cos(2t)$ gives $P(0) = -3$ (right).
Checking another point: $P\left(\frac{\pi}{2}\right) = -3\cos(\pi) = -3 \cdot (-1) = 3$, which is the maximum of the graph.
Answer: alternative A ($P(t) = -3\cos(2t)$).
Be careful with the catch: the amplitude is the distance from the center (0) to the peak (3), not from lowest to highest point ($3 - (-3) = 6$), which would take to alternatives D and E.
Question 162: Message between ships (defined operations)
Statement
For communication between two ships, a coding system is used with based on numerical values. For this, triangle operations are considered $\Delta$ and star $\ast$, defined over the set of real numbers by $x \Delta y = x^2 + xy - y^2$ and $x \ast y = xy + x$.
The ship that wants to send a message must provide an input value $b$, which will generate an output value, to be sent to the receiving ship, given by the sum of the two largest solutions of equation $(a \Delta b) \ast (b \Delta a) = 0$. Each possible input and output value represents a different message already known by both ships.
One ship wants to send the message “ATTENTION!” to the other. To do this, you must use the input value $b = 1$.
In this way, the amount received by the receiving vessel will be
- A) $\sqrt{5}$
- B) $\sqrt{3}$
- C) $\sqrt{1}$
- D) $\dfrac{-1 + \sqrt{5}}{2}$
- E) $\dfrac{3 + \sqrt{5}}{2}$
Resolution
The unknown is $a$; the value $b = 1$ is fixed.
1. Calculate the two triangle operations with $b = 1$:
$$u = a \Delta 1 = a^2 + a \cdot 1 - 1^2 = a^2 + a - 1$$$$v = 1 \Delta a = 1^2 + 1 \cdot a - a^2 = 1 + a - a^2$$2. Apply the star. By definition, $u \ast v = uv + u = u(v + 1)$. A equation becomes
$$u \cdot (v + 1) = 0$$A product is zero when one of the factors is zero.
3. Case $u = 0$:
$$a^2 + a - 1 = 0 \quad\Rightarrow\quad a = \frac{-1 \pm \sqrt{1 + 4}}{2} = \frac{-1 \pm \sqrt{5}}{2}$$i.e. $a \approx 0{,}618$ or $a \approx -1{,}618$.
4. Case $v + 1 = 0$:
$$2 + a - a^2 = 0 \quad\Rightarrow\quad a^2 - a - 2 = 0 \quad\Rightarrow\quad (a - 2)(a + 1) = 0$$i.e. $a = 2$ or $a = -1$.
5. The two biggest solutions. The four solutions, in order: $-1{,}618$; $-1$; $0{,}618$; $2$. The two biggest are $2$ and $\frac{-1 + \sqrt{5}}{2}$:
$$2 + \frac{-1 + \sqrt{5}}{2} = \frac{4 - 1 + \sqrt{5}}{2} = \frac{3 + \sqrt{5}}{2}$$Answer: alternative E ($\frac{3 + \sqrt{5}}{2}$).
Be careful with the catch: alternative D is just one of the solutions. It is also easy to get the order wrong in $1 \Delta a$: here $x = 1$ and $y = a$, so the term negative is $-a^2$.
For review, see Bhãskara.
Question 163: Scale of the castle replica
Statement
A Brazilian theme park built a miniature replica of the castle of Liechtenstein. The original castle, represented in the image, is located in Germany and was rebuilt between the years 1840 and 1842, after two destructions caused by wars.
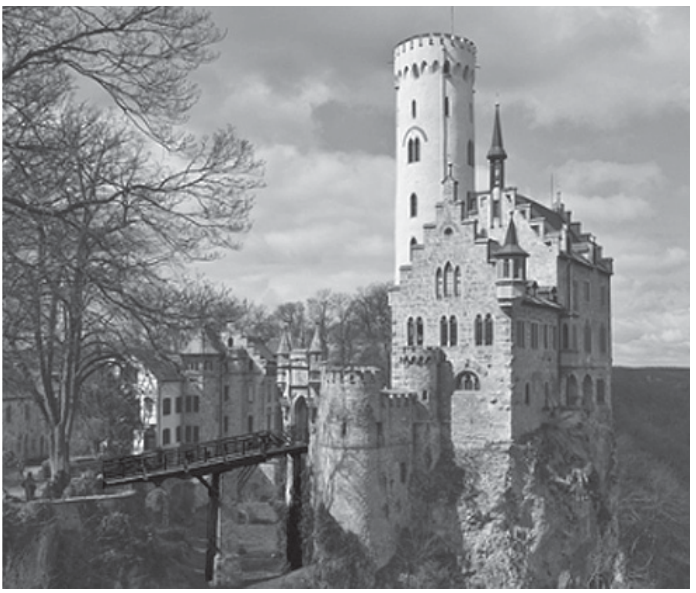
The castle has a bridge 38,4 m long and 1,68 m wide. O Craftsman who worked for the park produced a replica of the castle, to scale. In this work, the measurements of the length and width of the bridge were, respectively, 160 cm and 7 cm.
The scale used to make the replica is
- A) 1 : 576
- B) 1 : 240
- C) 1 : 24
- D) 1 : 4,2
- E) 1 : 2,4
Resolution
The scale is the ratio measured in the replica: actual measurement, with the two measurements in same unit.
1. Switch to centimeters: 38.4 m = 3 840 cm and 1.68 m = 168 cm.
2. Length ratio:
$$\frac{160}{3\thinspace 840} = \frac{1}{24}$$3. Checking the width:
$$\frac{7}{168} = \frac{1}{24}$$The two ratios are the same, as they should be in a scale replica.
Answer: alternative C (1 : 24).
Be careful with the catch: compare without converting units ($\frac{160}{38{,}4}$ or $\frac{7}{1{,}68}$) gives about 4,2 and leads to alternative D, which is a meaningless magnification scale here.
To review, see Proportions.
Question 164: Doctors per thousand inhabitants in 2020
Statement
Medical demography is the study of the population of doctors in Brazil in terms of quantitative and qualitative, one of its objectives being to make projections on the need to train new doctors. One of these studies generated a set of data that addresses the evolution of the number of doctors and the Brazilian population for several decades. The table presents part of this data.
| Year | Doctors | Brazilian population (in thousands) |
|---|---|---|
| 1990 | 219 000 | 147 000 |
| 2000 | 292 000 | 170 000 |
| 2010 | 365 000 | 191 000 |
According to a statistical projection, the variation in the number of doctors and the Brazilian population from 2010 to 2020 will be the average between the variation of 1990 to 2000 and from 2000 to 2010. With the result of this projection, the number of doctors per thousand inhabitants in the year 2020.
Available at: www.cremesp.org.br. Accessed in: 24 Jun. 2015 (adapted).
The number, with two decimal places, closest to the number of doctors per thousand inhabitants in the year 2020 would be
- A) 0,17.
- B) 0,49.
- C) 1,71.
- D) 2,06.
- E) 3,32.
Resolution
1. Doctors in 2020. The variations were $292\thinspace 000 - 219\thinspace 000 = 73\thinspace 000$ and $365\thinspace 000 - 292\thinspace 000 = 73\thinspace 000$. The average is 73 000:
$$365\thinspace 000 + 73\thinspace 000 = 438\thinspace 000 \text{ médicos}$$2. Population in 2020 (in thousands). The variations were $170\thinspace 000 - 147\thinspace 000 = 23\thinspace 000$ and $191\thinspace 000 - 170\thinspace 000 = 21\thinspace 000$. The average is
$$\frac{23\thinspace 000 + 21\thinspace 000}{2} = 22\thinspace 000$$$$191\thinspace 000 + 22\thinspace 000 = 213\thinspace 000 \text{ milhares de habitantes}$$3. Doctors per thousand inhabitants. The population is already in the thousands, so just divide:
$$\frac{438\thinspace 000}{213\thinspace 000} \approx 2{,}056 \approx 2{,}06$$Answer: alternative D (2,06).
Be careful with the catch: the population column is in thousands. She already counts “groups of a thousand inhabitants”, which is exactly what the question asks for.
Question 165: Month of highest profit
Statement
A company’s revenue $R$ at the end of a month is the money raised from the sale of goods or the provision of services in that month, and the expense $D$ is all the money used to pay salaries, water and electricity bills, taxes, among others. The monthly profit obtained at the end of the month is the difference between the revenue and expenses recorded in the month. The graph shows the revenues and expenses, in millions of reais, of a company at the end of the first five months of a given year.
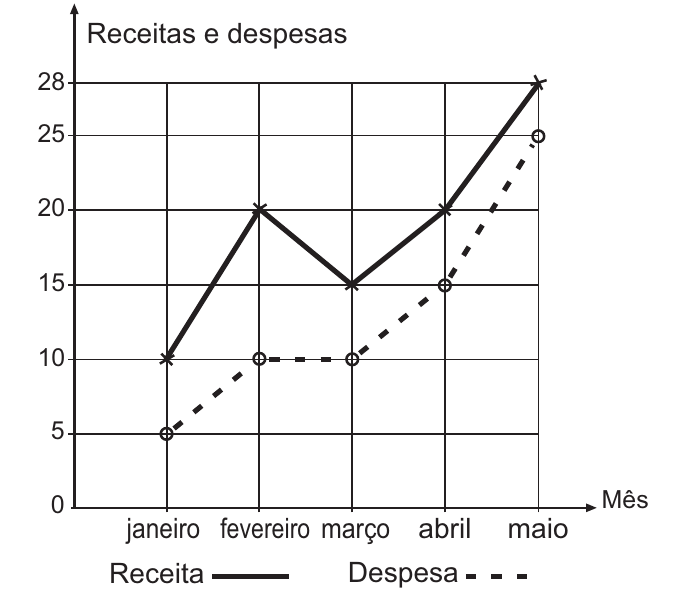
The forecast for the coming months is that the monthly profit will not be less than the highest profit obtained until the month of May.
Under these conditions, the monthly profit for the next few months must be greater than or equal to to the month of
- A) January.
- B) February.
- C) March.
- D) April.
- E) May.
Resolution
Each month’s profit is the vertical distance between the revenue line (continuous) and expenditure (dashed). Reading the graph, in millions of reais:
| Month | Revenue | Expense | Profit |
|---|---|---|---|
| January | 10 | 5 | 5 |
| February | 20 | 10 | 10 |
| March | 15 | 10 | 5 |
| April | 20 | 15 | 5 |
| May | 28 | 25 | 3 |
The biggest profit was in February (10 million).
Answer: alternative B (February).
Beware of the catch: May has the highest revenue (28), but also the biggest expense, and ends up being the month with lowest profit. Profit is the difference, not the recipe.