Euler's Eyes
2026-09-26
ENEM 2021 – Solved mathematics: questions 166 to 180
Source: INEP – proof and template of the 2nd day, Notebook 5 – Yellow (1st application).
The ENEM Mathematics and Technologies test 2021 was administered on the 2nd day and will from question 136 to 180. This post addresses questions 166 to 180. The numbering used here is that of the Notebook 5 – Yellow; us In other notebooks the same questions appear in a different order.
Template
| Question | Subject | Template |
|---|---|---|
| 166 | Percentage increase | C |
| 167 | Histogram and accumulated frequency | C |
| 168 | Caesar cipher and letter frequency | C |
| 169 | Statistics: median | C |
| 170 | Percentage: reservoir volume | D |
| 171 | Weighted average | D |
| 172 | Weighted average and linear system | C |
| 173 | Coefficient of variation | E |
| 174 | Comparison of means | E |
| 175 | Weighted average: monthly revenue | B |
| 176 | Algebraic expression with percentage | A |
| 177 | Probability of the complementary event | B |
| 178 | Combinatorial analysis (cancelled) | Canceled |
| 179 | Powers of the golden ratio | E |
| 180 | Orthogonal projection of the cube | E |
Question 166: Increase in sales of antidepressants
Statement
Depression is characterized by an imbalance in brain chemistry. The Neurons in a depressed person do not respond well to stimuli from neurotransmitters. Medicines that combat depression aim to restore brain chemistry. With the gradual increase in cases of depression, the sale of these medicines is increasingly evolving, as illustrated by the graphic.
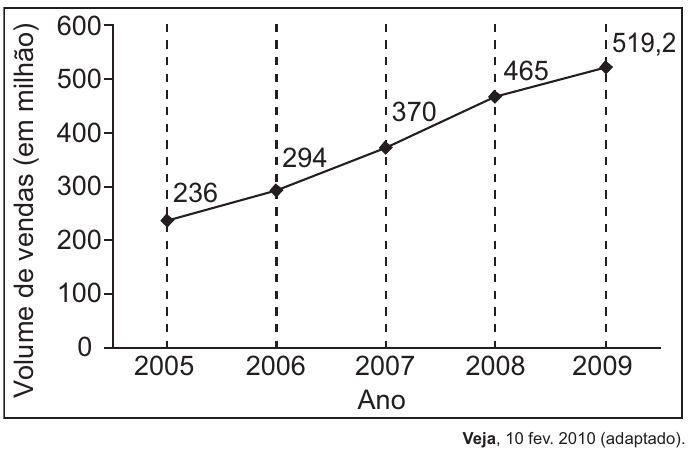
In the period from 2005 to 2009, the percentage increase in sales volume was
- A) 45,4.
- B) 54,5.
- C) 120.
- D) 220.
- E) 283,2.
Resolution
The percentage increase compares the increase with the initial value.
1. Absolute increase(in millions):
$$519{,}2 - 236 = 283{,}2$$2. Percentage increase:
$$\frac{283{,}2}{236} = 1{,}2 = 120\%$$Answer: alternative C (120%).
Be careful with the catch: 283,2 (alternative E) is the increase in millions, not in percentage. And 220 (alternative D) is $\frac{519{,}2}{236} = 2{,}2$ written as 220%: this is the final value in relation to the initial one, not the increase. The increase is $220\% - 100\% = 120\%$.
To review, see Percentage Basics.
Question 167: Price of apartments using histogram
Statement
A couple is planning to buy a two-bedroom apartment in a neighborhood of a city and consulted a real estate agent’s page, finding 105 two-bedroom apartments for sale in the desired neighborhood. They used a broker’s application to generate the distribution of prices for the set of selected properties.
The graph illustrates the frequency distribution of sales prices of apartments from this list (in thousand reais), in which the price ranges are given by ]300, 400], ]400, 500], ]500, 600], ]600, 700], ]700, 800], ]800, 900], ]900, 1 000], ]1 000, 1 100], ]1 100, 1 200] and ]1 200, 1 300].
The same brokerage announces that around 50% of two-bedroom apartments in this neighborhood, published on your page, have a sales price of less than 550 thousand real. However, the couple felt that this last information was not compatible with the graph obtained.
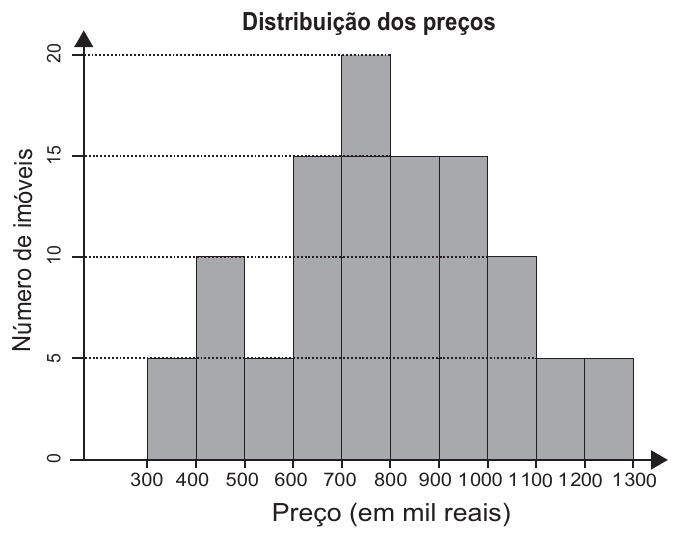
Based on the graph obtained, the lowest price, $p$ (in thousand reais), for which at least least 50% of apartments are priced lower than $p$ is
- A) 600.
- B) 700.
- C) 800.
- D) 900.
- E) 1 000.
Resolution
1. Read the frequencies of each track and accumulate:
| Range (thousand reais) | Real Estate | Accumulated |
|---|---|---|
| ]300, 400] | 5 | 5 |
| ]400, 500] | 10 | 15 |
| ]500, 600] | 5 | 20 |
| ]600, 700] | 15 | 35 |
| ]700, 800] | 20 | 55 |
| ]800, 900] | 15 | 70 |
| ]900, 1 000] | 15 | 85 |
| ]1 000, 1 100] | 10 | 95 |
| ]1 100, 1 200] | 5 | 100 |
| ]1 200, 1 300] | 5 | 105 |
The total adds up to: 105 apartments.
2. How much is 50%? $\frac{105}{2} = 52{,}5$ apartments.
3. Look for where the accumulation exceeds 52,5:
- up to 600: 20 apartments (about 19%);
- up to 700: 35 apartments (about 33%), still less than half;
- up to 800: 55 apartments (about 52%), at least half.
Among the values of the alternatives, the smallest that guarantees at least 50% is $p = 800$.
(This also shows why the broker’s ad was not compliant: below 550 thousand there are, at most, 20 apartments, less than 20% of the total.)
Answer: alternative C (800 thousand reais).
Beware of the catch: the highest bar (]700, 800]) is the fashion, It has no direct relationship with 50%. What answers the question is frequency accumulated.
To review, see Position Measurements.
Question 168: Caesar Cipher and the most frequent letters
Statement
The Caesar Cipher is an example of a message encoding method used by Julius Caesar to communicate with his generals.
In the method, each letter was replaced by a letter that appeared in the alphabet one fixed number of spaces forward (or backward) in a cyclical manner. Next we have a example in which each letter is replaced by the one that comes three positions ahead.
| Original | A | B | C | D | E | F | G | H | I | J | K | L | M | N | O | P | Q | R | S | T | U | V | W | X | Y | Z |
|---|---|---|---|---|---|---|---|---|---|---|---|---|---|---|---|---|---|---|---|---|---|---|---|---|---|---|
| Encoded | D | E | F | G | H | I | J | K | L | M | N | O | P | Q | R | S | T | U | V | W | X | Y | Z | A | B | C |
To break a code like this, analyzing the frequencies of the letters in a Text is an important tool.
An analysis of the text of the novel O guarani, by José de Alencar, which is composed by 491 631 letters, generated the following frequency graph:
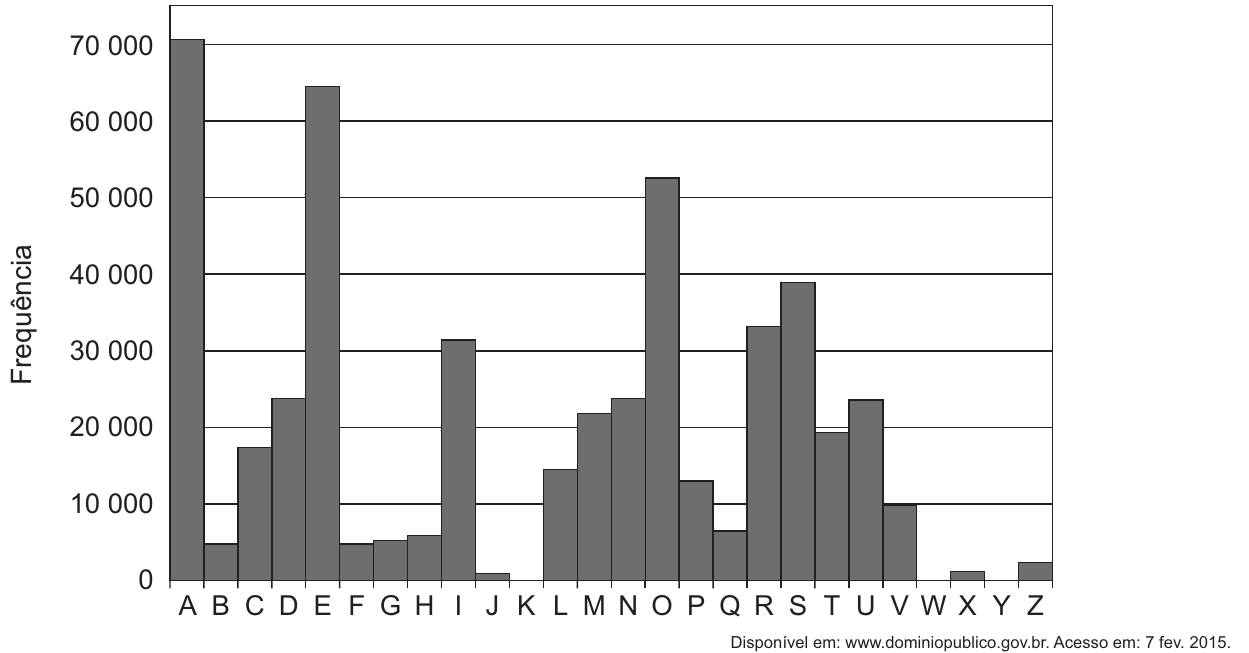
After coding this text with the rule in the example provided, a new analysis is carried out frequency in the coded text.
The four most frequent letters, in decreasing order of frequency, in the text coded are
- A) A, E, O e S.
- B) D, E, F e G.
- C) D, H, R e V.
- D) R, L, B e X.
- E) X, B, L e P.
Resolution
1. The four most frequent letters in the original text. From the graph, in descending order:
- A (about 70 000);
- E (about 65 000);
- O (about 53 000);
- S (about 39 000).
2. Encode. Each letter becomes the one three positions ahead, and the frequency goes along with it: every A in the text becomes D, every E becomes H, and so on forward.
- A → D
- E → H
- O → R
- S → V
3. Result. In the coded text, the most frequent are D, H, R and V, in that order.
Answer: alternative C (D, H, R and V).
Be careful with the catch: alternative A (A, E, O and S) are the most frequent text original; the question is about the encoded text.
Question 169: Median number of earthquakes
Statement
The table shows the number of earthquakes with a magnitude greater than or equal to 7, in Richter scale, which occurred on our planet in the years 2000 to 2011.
| Year | 2000 | 2001 | 2002 | 2003 | 2004 | 2005 | 2006 | 2007 | 2008 | 2009 | 2010 | 2011 |
|---|---|---|---|---|---|---|---|---|---|---|---|---|
| Earthquakes | 15 | 16 | 13 | 15 | 16 | 11 | 11 | 18 | 12 | 17 | 24 | 20 |
Available on: https://earthquake.usgs.gov/earthquakes/browse/m7-world.php. Accessed on: 13 Aug. 2012 (adapted).
One researcher believes that the median represents well the typical annual number of earthquakes in a period.
According to this researcher, the typical annual number of earthquakes of greater magnitude or equal to 7 is
- A) 11.
- B) 15.
- C) 15,5.
- D) 15,7.
- E) 17,5.
Resolution
1. Sort the 12 values:
$$11, \quad 11, \quad 12, \quad 13, \quad 15, \quad 15, \quad 16, \quad 16, \quad 17, \quad 18, \quad 20, \quad 24$$2. Central terms. These are 12 values (even quantity), so the median is the average of the 6th and 7th terms: 15 and 16.
$$\text{Mediana} = \frac{15 + 16}{2} = 15{,}5$$Answer: alternative C (15,5).
Beware of the catch: 15,7 (alternative D) is the average ($\frac{188}{12} \approx 15{,}7$), not the median. And 11 (alternative A) is the fashion. Without ordering, the middle two would be 11 and 11 (2005 and 2006).
To review, see Position Measurements.
Question 170: Reservoir with the largest volume of water
Statement
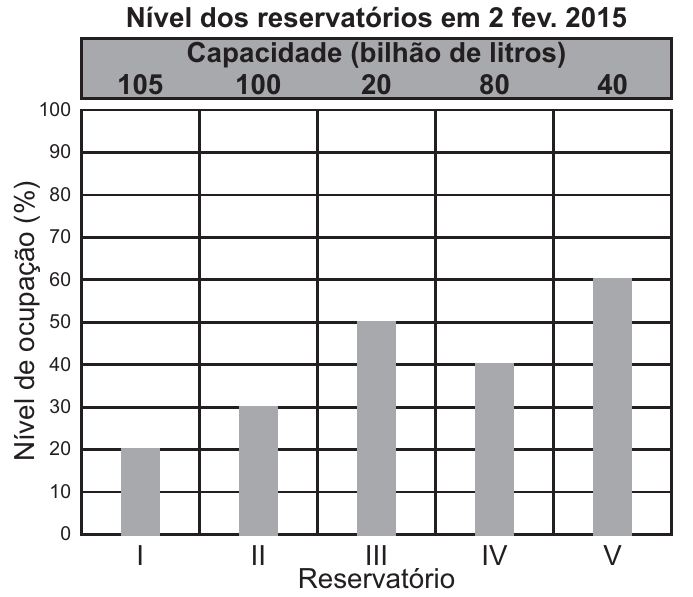
The graph shows the occupancy level of the five water reservoirs that supplied a city in 2 February 2015.
On that date, the reservoir with the largest volume of water was the
- A) I.
- B) II.
- C) III.
- D) IV.
- E) V.
Resolution
The graph shows the percentage occupied, and the capacity of each reservoir it’s different. The volume of water is
$$\text{volume} = \text{capacidade} \times \text{nível de ocupação}$$| Reservoir | Capacity (billion L) | Level | Volume (billion L) |
|---|---|---|---|
| I | 105 | 20% | $105 \cdot 0{,}2 = 21$ |
| II | 100 | 30% | $100 \cdot 0{,}3 = 30$ |
| III | 20 | 50% | $20 \cdot 0{,}5 = 10$ |
| IV | 80 | 40% | $80 \cdot 0{,}4 = 32$ |
| V | 40 | 60% | $40 \cdot 0{,}6 = 24$ |
Answer: alternative D (reservoir IV, with 32 billion liters).
Be careful with the catch: reservoir V has the highest bar (60%), but it’s small. And I is the biggest, but it’s almost empty. It is necessary to multiply the two pieces of information.
To review, see Percentage Basics.
Question 171: Average ages from the graph
Statement
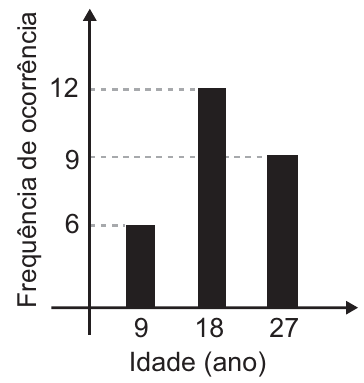
A person carried out a survey with some students at a school, collecting their ages, and organized this data on the graph.
What is the average age, in years, of these students?
- A) 9
- B) 12
- C) 18
- D) 19
- E) 27
Resolution
The graph shows: 6 students with 9 years old, 12 students with 18 years old and 9 students with 27 years old years. The average is weighted by frequencies.
1. Sum of all ages:
$$6 \cdot 9 + 12 \cdot 18 + 9 \cdot 27 = 54 + 216 + 243 = 513$$2. Number of students: $6 + 12 + 9 = 27$.
3. Average:
$$\bar{x} = \frac{513}{27} = 19 \text{ anos}$$Answer: alternative D (19 years).
Be careful with the catch: the simple average of the three ages, $\frac{9 + 18 + 27}{3} = 18$ (alternative C), ignores how many students have each age. And 12 (option B) is the highest frequency, not an age.
To review, see Position Measurements.
Question 172: Reading time by age group
Statement
In a study carried out by IBGE in four states and the Federal District, with more than 5 thousand people aged 10 years or more, it was observed that reading occupies, in average, just six minutes of each person’s day. In the age range 10 to 24 years, the daily average is three minutes. However, in the age group between 24 and 60 years, the average daily time dedicated to reading is 5 minutes. Among the most old, 60 years or older, the average is 12 minutes.
The number of people interviewed in each age group followed the percentage distribution described in the table.
| Age range | Percentage of respondents |
|---|---|
| From 10 to 24 years | $x$ |
| Between 24 and 60 years | $y$ |
| From 60 years | $x$ |
Available at: www.oglobo.globo.com. Accessed on: 16 Aug. 2013 (adapted).
The values of $x$ and $y$ of the frame are, respectively, equal to
- A) 10 e 80.
- B) 10 e 90.
- C) 20 e 60.
- D) 20 e 80.
- E) 25 e 50.
Resolution
1. The percentages add up to 100:
$$x + y + x = 100 \quad\Rightarrow\quad 2x + y = 100$$2. The overall average (6 minutes) is the weighted average of the averages for each band, with weights equal to the percentages:
$$\frac{3x + 5y + 12x}{100} = 6 \quad\Rightarrow\quad 15x + 5y = 600 \quad\Rightarrow\quad 3x + y = 120$$3. Solve the system. Subtracting the first equation from the second:
$$(3x + y) - (2x + y) = 120 - 100 \quad\Rightarrow\quad x = 20$$$$y = 100 - 2 \cdot 20 = 60$$Checking: $\frac{3 \cdot 20 + 5 \cdot 60 + 12 \cdot 20}{100} = \frac{60 + 300 + 240}{100} = 6$.
Answer: alternative C ($x = 20$ and $y = 60$).
Be careful with the catch: alternative D (20 and 80) does not add up to 100% ($20 + 80 + 20 = 120$): remember that $x$ appears twice times in the frame.
To review, see Position Measurements.
Question 173: Coefficient of variation of the new ration
Statement
A zootechnician intends to test whether a new feed for rabbits is more efficient than what he is currently using. The current ration provides a mass average of 10 kg per rabbit, with a standard deviation of 1 kg, fed with this feed over a period of three months.
The zootechnician selected a sample of rabbits and fed them with the new food for the same period of time. At the end, he wrote down the mass of each rabbit, obtaining a standard deviation of 1,5 kg for the mass distribution of rabbits in this sample.
To evaluate the efficiency of this feed, he will use the coefficient of variation ($CV$) which is a measure of dispersion defined by $CV = \frac{s}{\bar{x}}$, in where $s$ represents the standard deviation and $\bar{x}$, the average of the rabbit masses that were fed a certain ration.
The zootechnician will replace the feed he had been using with the new one, if the coefficient of variation of the mass distribution of the rabbits that were fed with the new feed is smaller than the coefficient of variation of the distribution of the masses of rabbits that were fed with the current diet.
Feed replacement will occur if the average mass distribution of sample rabbits, in kilograms, is greater than
- A) 5,0.
- B) 9,5.
- C) 10,0.
- D) 10,5.
- E) 15,0.
Resolution
1. CV of current ration:
$$CV_{\text{atual}} = \frac{1}{10} = 0{,}1$$2. Condition for switching. Let $\bar{x}$ be the mean of the new sample:
$$CV_{\text{nova}} = \frac{1{,}5}{\bar{x}} < 0{,}1$$3. Solve the inequality. As $\bar{x} > 0$, we can multiply the two sides by $\bar{x}$ without inverting the sign:
$$1{,}5 < 0{,}1 \cdot \bar{x} \quad\Rightarrow\quad \bar{x} > \frac{1{,}5}{0{,}1} = 15$$Answer: alternative E (15,0 kg).
Be careful with the trick: whoever thinks “the CV decreases when the average increases, so just go beyond 10 kg” marks alternative C. As the deviation standard of the new ration is higher (1,5 kg), the average needs to increase in the same way proportion: $10 \cdot 1{,}5 = 15$.
To review, see Dispersion Measures.
Question 174: Snack with the highest average per franchise
Statement
A hamburger chain has three franchises in different cities. Aiming include a new type of snack on the menu, the chain’s marketing manager suggested that five new types of snacks be put on sale, in editions specials. Snacks were offered for the same period of time in all franchisees. The type that presented the highest average per franchise would be included definitely on the menu. After the trial period ends, management received a report describing the quantities sold, in units, of each of the five types of snacks in the three franchises.
| Snack I | Snack II | Snack III | Snack IV | Snack V | |
|---|---|---|---|---|---|
| Franchise I | 415 | 395 | 425 | 430 | 435 |
| Franchise II | 415 | 445 | 370 | 370 | 425 |
| Franchise III | 415 | 390 | 425 | 433 | 420 |
Based on this information, management decided to include a snack on the menu. type
- A) I.
- B) II.
- C) III.
- D) IV.
- E) V.
Resolution
The average per franchise is the sum of the column divided by 3. Like all columns are divided by the same number, just compare the sums:
| Snack | Sum | Average |
|---|---|---|
| I | $415 + 415 + 415 = 1\thinspace 245$ | 415 |
| II | $395 + 445 + 390 = 1\thinspace 230$ | 410 |
| III | $425 + 370 + 425 = 1\thinspace 220$ | ≈ 406,7 |
| IV | $430 + 370 + 433 = 1\thinspace 233$ | 411 |
| V | $435 + 425 + 420 = 1\thinspace 280$ | ≈ 426,7 |
The highest average is snack V.
Answer: alternative E (snack V).
Be careful with the catch: the largest number in a single franchise is 445 of snack II, but the decision is based on the average of the three franchises.
To review, see Position Measurements.
Question 175: Commission for average billing
Statement
A large supermarket chain adopts a billing assessment system of its branches, considering the average monthly revenue in million. The matrix of the chain pays a commission to supermarket representatives who reach an average monthly billing ($M$), as shown in the table.
| Commission | Average monthly revenue ($M$) |
|---|---|
| I | $1 \le M < 2$ |
| II | $2 \le M < 4$ |
| III | $4 \le M < 5$ |
| IV | $5 \le M < 6$ |
| V | $M \ge 6$ |
A chain supermarket obtained revenues in a given year, as presented in the table.
| Monthly revenue (in million reais) | Number of months |
|---|---|
| 3,5 | 3 |
| 2,5 | 2 |
| 5 | 2 |
| 3 | 4 |
| 7,5 | 1 |
Under the conditions presented, the representatives of this supermarket assess that will receive, the following year, the type commission
- A) I.
- B) II.
- C) III.
- D) IV.
- E) V.
Resolution
1. Total revenue for the year (in millions):
$$3{,}5 \cdot 3 + 2{,}5 \cdot 2 + 5 \cdot 2 + 3 \cdot 4 + 7{,}5 \cdot 1 = 10{,}5 + 5 + 10 + 12 + 7{,}5 = 45$$2. Number of months: $3 + 2 + 2 + 4 + 1 = 12$.
3. Monthly average:
$$M = \frac{45}{12} = 3{,}75 \text{ milhões}$$As $2 \le 3{,}75 < 4$, the commission is type II.
Answer: alternative B (commission II).
Be careful with the catch: the simple average of the five revenues, $\frac{3{,}5 + 2{,}5 + 5 + 3 + 7{,}5}{5} = 4{,}3$, would lead to commission III (alternative C). But each value occurred in a different number of months: the average has to be considered.
To review, see Position Measurements.
Question 176: Price of hosting for the application
Statement
Applications that manage hosting services have gained space in Brazil and in the world for offering differentiated options in terms of location and price hosting. In one of these applications, the price $P$ to be paid for hosting is calculated considering a price per night $d$, plus a fixed rate of cleaning $L$ and a service charge. This service fee is a value percentage $s$ calculated on the amount paid for the total daily rates.
In this situation, the price to be paid to the application for a hosting of $n$ daily rates can be obtained by the expression
- A) $P = d \cdot n + L + d \cdot n \cdot s$
- B) $P = d \cdot n + L + d \cdot s$
- C) $P = d + L + s$
- D) $P = d \cdot n \cdot s + L$
- E) $P = d \cdot n + L + s$
Resolution
We will set the price part by part.
1. Total daily rates: $n$ daily $d$ reais each cost $d \cdot n$.
2. Cleaning rate: is fixed, $L$ (does not depend on $n$).
3. Service fee: is the percentage $s$ of the total daily rates, or that is, $s$ times $d \cdot n$:
$$d \cdot n \cdot s$$4. Adding it all up:
$$P = d \cdot n + L + d \cdot n \cdot s$$Answer: alternative A.
Be careful with the catch: in alternative B the rate is calculated on a daily rate only ($d \cdot s$), and in E it is added as if it were a fixed value in real ($+ s$). The statement says that the percentage applies to the total of daily.
Question 177: Minimum number of darts
Statement
The organizer of a dart throwing competition wants to make the more competitive championship. According to the current rules of the competition, in one round, the player throws 3 darts and scores if he hits at least one of them on the target. O organizer considers that, on average, players have, on each throw, $\frac{1}{2}$ probability of hitting a dart on the target.
In order to make the game more attractive, he plans to modify the rules so that the probability of a player scoring in a round is equal to or greater than $\frac{9}{10}$. To do this, decide to increase the number of darts to be released in each round.
Based on the values considered by the competition organizer, the amount minimum number of darts that must be made available in a round to make the game more attractive is
- A) 2.
- B) 4.
- C) 6.
- D) 9.
- E) 10.
Resolution
1. Use the complement. “Get at least one” is the opposite of “err all”. With $n$ darts, and each independent throw with probability $\frac{1}{2}$ of error:
$$P(\text{errar todos}) = \left(\frac{1}{2}\right)^n$$$$P(\text{pontuar}) = 1 - \left(\frac{1}{2}\right)^n$$2. Condition:
$$1 - \frac{1}{2^n} \ge \frac{9}{10} \quad\Rightarrow\quad \frac{1}{2^n} \le \frac{1}{10} \quad\Rightarrow\quad 2^n \ge 10$$3. Test the powers of 2:
- $n = 3$: $2^3 = 8 < 10$ (the current rule only gives $1 - \frac{1}{8} = 0{,}875$);
- $n = 4$: $2^4 = 16 \ge 10$, and the probability becomes $1 - \frac{1}{16} = 0{,}9375$.
The minimum is 4 darts.
Answer: alternative B (4 darts).
Be careful with the catch: alternative A (2 darts) decreases the current quantity; the statement asks to increase, and with 2 darts to probability would just be $\frac{3}{4}$.
To review, see Introduction to Probability.
Question 178: Brazil Cup champions panel (cancelled)
Question canceled by INEP. In the official answer sheet of the Notebook 5 – Yellow, this question appears as “canceled”; all candidates received the score. The template does not indicate the reason for the cancellation, so it is not we present an “official” resolution.
Statement
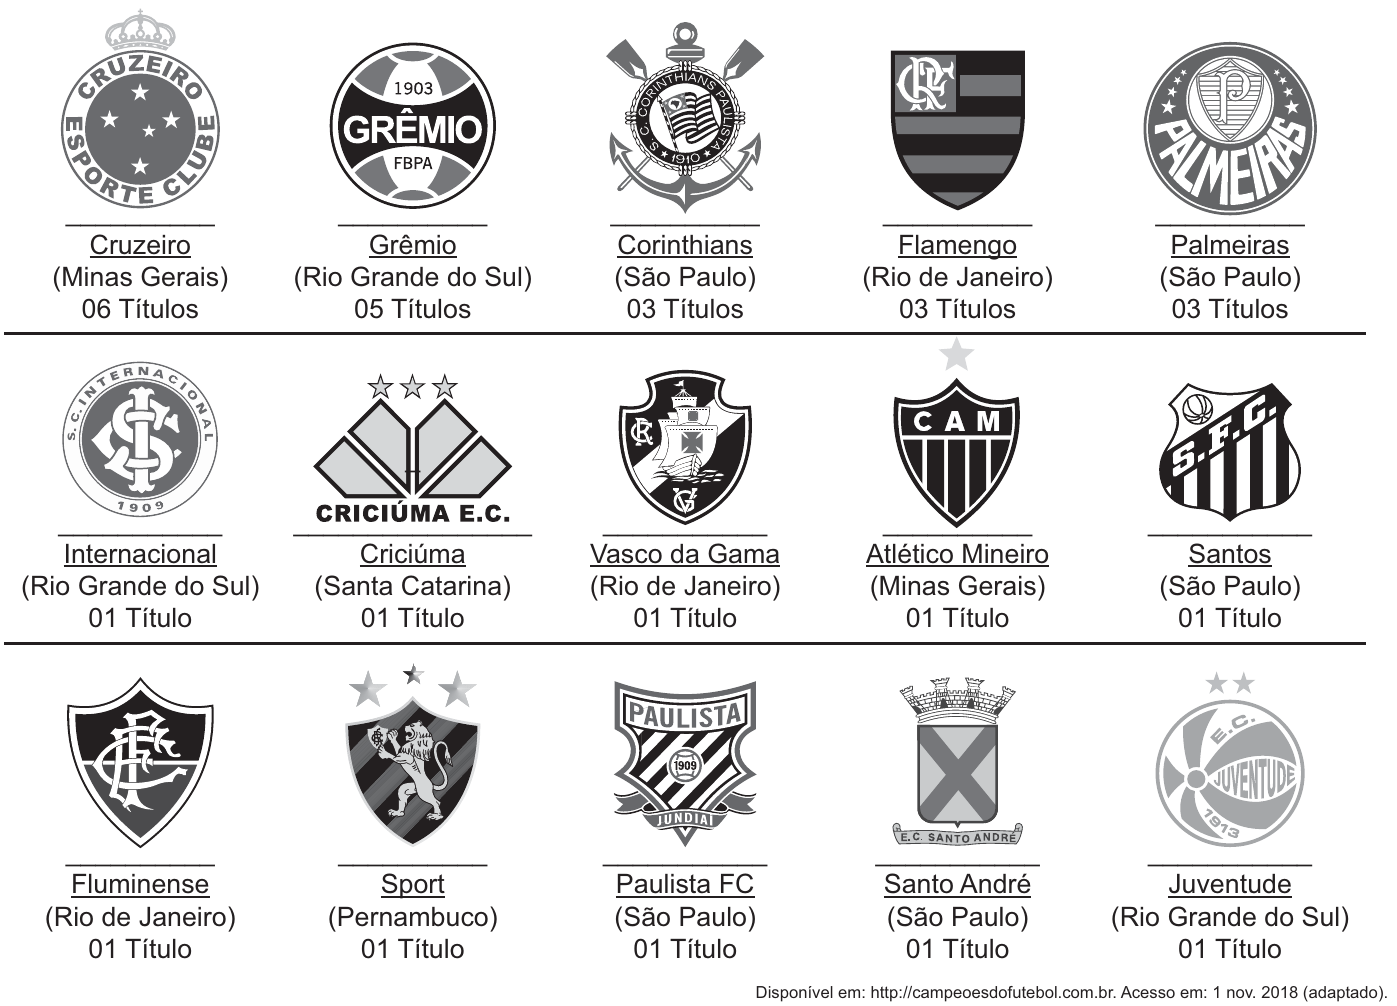
Until the edition of 2018, 15 the Copa do Brasil had different teams as champions of the competition, as shown in the image. Suppose, as a tribute to the champion teams, the Brazilian Football Confederation (CBF) intends to place a panel at your headquarters. This panel would have 6 lines and, in each of them, 5 plates, referring to each edition of the competition, with the name of the winning team, the coat of arms and the year of the title. The panel must be manufactured so that the first line only have clubs from Rio Grande do Sul (Internacional, Grêmio and Juventude); the second, just teams from Rio (Flamengo, Vasco and Fluminense); the third, only teams miners (Cruzeiro and Atlético Mineiro); the fourth, exclusively clubs paulistas (Corinthians, Palmeiras, Santos, Paulista FC, Santo André), and the two last without any restrictions.
Which expression determines the number of different panels that the CBF will be able to assemble?
A)
$$\frac{7!}{5!} \cdot \frac{5!}{3!} \cdot \frac{7!}{6!} \cdot \frac{9!}{3! \cdot 3!} \cdot 10!$$B)
$$7! \cdot 5! \cdot 7! \cdot 9! \cdot 10!$$C)
$$30!$$D)
$$\frac{7!}{5! \cdot 5!} \cdot \frac{7!}{5! \cdot 2!} \cdot \frac{9!}{5! \cdot 4!}$$E)
$$\frac{9!}{3!} \cdot 5! \cdot \frac{7!}{2!} \cdot \frac{9!}{4!} \cdot 10!$$Comment
The question was canceled by INEP and, therefore, there is no correct alternative official. It is worth observing the image data, which helps to understand the problem: adding up the titles, they are 30 plates (6 lines × 5 plates); the gauchos have $5 + 1 + 1 = 7$ titles, the cariocas $3 + 1 + 1 = 5$, the miners $6 + 1 = 7$ and the paulistas $3 + 3 + 1 + 1 + 1 = 9$. Each “regional” line uses only 5 of these plates, and the leftovers go, together with those from Criciúma and Sport, to the last two lines.
Question 179: Power of the golden ratio
Statement
A line segment is divided into two parts in the golden ratio when the whole is to one of the parts in the same ratio as that part is to the another. This proportionality constant is commonly represented by the letter $\varphi$, and its value is given by the positive solution of the equation $\varphi^2 = \varphi + 1$.
Just like the power $\varphi^2$, the higher powers of $\varphi$ can be expressed in the form $a\varphi + b$, where $a$ and $b$ are positive integers, such as presented in the table.
| $\varphi^2$ | $\varphi^3$ | $\varphi^4$ | $\varphi^5$ | $\varphi^6$ | $\varphi^7$ |
|---|---|---|---|---|---|
| $\varphi + 1$ | $2\varphi + 1$ | $3\varphi + 2$ | $5\varphi + 3$ | $8\varphi + 5$ | … |
The power $\varphi^7$, written in the form $a\varphi + b$ ($a$ and $b$ are integers positive), it is
- A) $5\varphi + 3$
- B) $7\varphi + 2$
- C) $9\varphi + 6$
- D) $11\varphi + 7$
- E) $13\varphi + 8$
Resolution
1. Multiply the last known power by $\varphi$:
$$\varphi^7 = \varphi \cdot \varphi^6 = \varphi\,(8\varphi + 5) = 8\varphi^2 + 5\varphi$$2. Swap $\varphi^2$ for $\varphi + 1$:
$$8(\varphi + 1) + 5\varphi = 8\varphi + 8 + 5\varphi = 13\varphi + 8$$Answer: alternative E ($13\varphi + 8$).
Tip (Fibonacci pattern): the coefficients follow the sequence of Fibonacci 1, 1, 2, 3, 5, 8, 13, …, where each term is the sum of the two previous ones. In general, if $\varphi^n = a\varphi + b$, then $\varphi^{n+1} = (a + b)\varphi + a$. From $8\varphi + 5$ comes $(8 + 5)\varphi + 8 = 13\varphi + 8$.
To review, see 2th degree equation.
Question 180: Projection of the path in Atomium
Statement
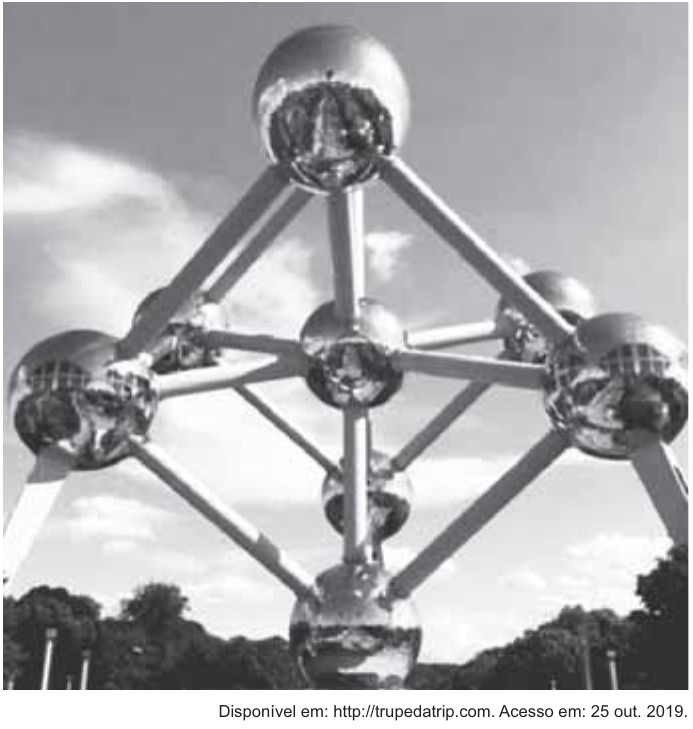
The Atomium, represented in the image, is one of the main tourist attractions in Brussels. It was built in 1958 for the first major world exhibition after the Second World War, the Brussels World Fair.
It is a metallic structure built in the shape of a cube. This structure is supported by one of the vertices on a base parallel to the plane of the ground, and the diagonal of the cube, containing this vertex, is orthogonal to the plane of the base. Centered on the vertices of this cube, eight metallic spheres were constructed, and another sphere was constructed centered on the point of intersection of the diagonals of the cube. The eight spheres on the vertices are interconnected according to their edges, and the central sphere connects to them by the diagonals of the cube.
All these interconnections are made by cylindrical tubes that have stairs inside, allowing people to move around the inside of the structure. On the diagonal orthogonal to the base, the movement is made by an elevator, which allows displacement between the base spheres and the sphere at the most high, passing through the central sphere.
Consider a visitor who moved around the interior of the Atomium, always in line straight and following the shortest path between two vertices, passing through all edges and all diagonals of the cube.
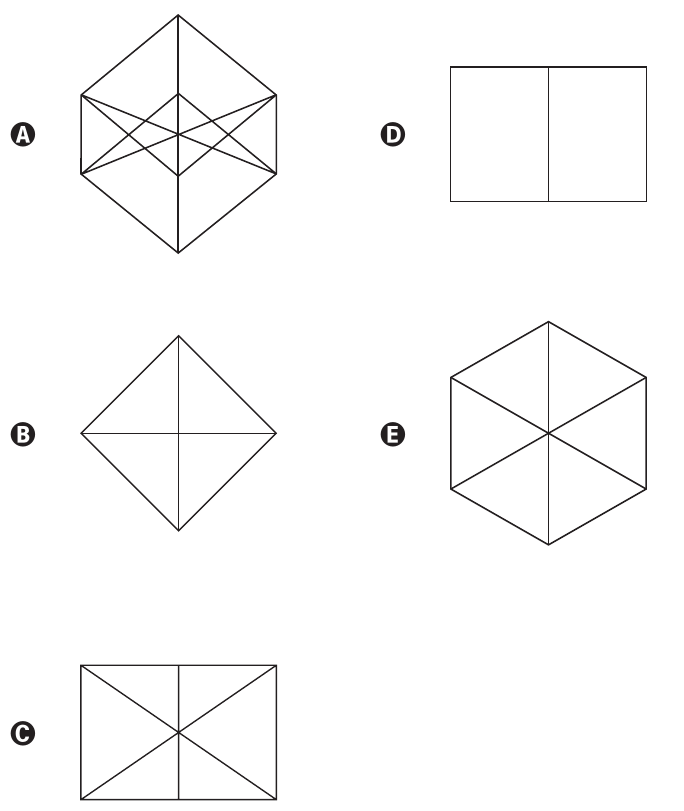
The orthogonal projection on the ground plane of the path taken by this visitor is represented by
Resolution
The path passes through all edges and all diagonals of the cube, so the projection of the path is the projection of the entire “skeleton” of the cube (edges + diagonals) over the ground. The key point is that the cube is standing on a vertex, with the diagonal that passes through this vertex vertical.
1. The two vertices of the vertical diagonal. The bottom vertex (support) and the one above above are in the same vertical, passing through the center of the cube. The two project at same point, the center $O$ of the figure. The vertical diagonal itself (the elevator) only turns to this point.
2. The other 6 vertices. Looking at the cube from above, along the diagonal, it has a rotational symmetry of 120°. The 3 neighboring vertices from the top are in a same height, forming a equilateral triangle, and the 3 neighbors of the base are at another height, forming another equilateral triangle, rotated by 60° in relation to the first. Projected, the 6 form a regular hexagon with center $O$.
3. The edges.
- The 3 edges that leave the top vertex and the 3 that leave the bottom vertex they go from $O$ to the vertices of the hexagon: they are the 6 “rays” of the hexagon.
- The other 6 edges connect a neighbor at the top to a neighbor at the bottom: they are the 6 sides of the hexagon.
4. The other 3 diagonals. Each one connects two opposite vertices of the cube passing through the center; in the projection, they go from a vertex of the hexagon to the vertex opposite, passing through $O$. They fall exactly on the rays already drawn.
The final figure is a regular hexagon with segments connecting the center to the six vertices.
Answer: alternative E.
Be careful with the catch: alternative A looks like a cube in perspective, but in an orthogonal projection seen from above the vertices of top and bottom coincide in the center, and there is no “crossed” segment left.