Euler's Eyes
2026-09-26
ENEM 2024 – Solved mathematics: questions 166 to 180
Source: INEP – proof and template of the 2nd day, Notebook 5 – Yellow.
The ENEM Mathematics and Technologies test 2024 was administered on the 2nd day and will from question 136 to 180. This post addresses questions 166 to 180. The numbering used here is that of the Notebook 5 – Yellow; us In other notebooks the same questions appear in a different order.
Template
| Question | Subject | Template |
|---|---|---|
| 166 | Price comparison | A |
| 167 | Percentage | B |
| 168 | Graph reading: function composition | B |
| 169 | Powers of 2 (geometric progression) | A |
| 170 | Percentage: profit and revenue | D |
| 171 | Solid of revolution | D |
| 172 | Area of the rectangle | D |
| 173 | Optimization: number of columns | C |
| 174 | Scale and area | E |
| 175 | Line chart reading | A |
| 176 | Percentage and decimal number | D |
| 177 | Quadratic function: maximum area | B |
| 178 | Representations of rational numbers | B |
| 179 | Exponential function | C |
| 180 | Volume of the cylinder and cube | E |
Question 166: In which store to buy the components
Statement
A craftsman uses two types of components, X and Y, in the ornaments he produces. He always buys all the components in the same store. The table presents the prices of the two types of components in stores I and II.
| Stores | Price of component X (R$) | Price of component Y (R$) |
|---|---|---|
| I | 3,00 | 1,00 |
| II | 2,00 | 4,00 |
He will make ornaments formed by two units of component unit of component Y and will make the purchase at the store that offers the lowest price total for making an ornament.
The artisan will make the purchase in the store
- A) I, as the value is R$ 7,00.
- B) I, as the value is R$ 4,00.
- C) II, as the value is R$ 6,00.
- D) I, as it advertises the component with the lowest price.
- E) II, as component X, which is the most used, has a lower price.
Resolution
An embellishment uses 2 X + 1 Y.
1. Cost in store I:
$$2 \cdot 3{,}00 + 1 \cdot 1{,}00 = 6{,}00 + 1{,}00 = 7{,}00$$2. Cost in store II:
$$2 \cdot 2{,}00 + 1 \cdot 4{,}00 = 4{,}00 + 4{,}00 = 8{,}00$$3. Compare: R$ 7,00 < R$ 8,00, so store I is the cheapest.
Answer: alternative A (store I, R$ 7,00).
Be careful with the catch: alternative B (R$ 4,00) adds an X and a Y, forgetting that there are two X. Alternative E seems logical, but Y much more expensive from the II store cancels out the advantage of the X.
Question 167: Concepts in a math marathon (percentage)
Statement
João and Felipe participated, at school, in a mathematics marathon in which, for a week, they solved 200 questions each. In this marathon, the percentage $P$ of each participant’s correct answers is converted into a concept:
- unsatisfactory: if $0 \leq P < 50$;
- regular: if $50 \leq P < 60$;
- good: if $60 \leq P < 75$;
- very good: if $75 \leq P < 90$;
- excellent: if $90 \leq P \leq 100$.
João got 75% of the marathon questions right and Felipe got 30% less than the number of questions that João got right.
João and Felipe’s concepts were, respectively,
- A) very good and good.
- B) very good and regular.
- C) very good and unsatisfactory.
- D) good and regular.
- E) good and unsatisfactory.
Resolution
1. João. $P = 75$ is in the range $75 \leq P < 90$: very good. In quantity, he got it right
$$0{,}75 \cdot 200 = 150 \text{ questões}$$2. Felipe. Correct 30% unless the amount of João, that is, 70% from 150:
$$0{,}70 \cdot 150 = 105 \text{ questões}$$3. Felipe’s percentage:
$$P = \frac{105}{200} = 0{,}525 = 52{,}5 \text{ por cento}$$It is in the range $50 \leq P < 60$: regular.
Answer: alternative B (very good and regular).
Be careful with the catch: doing $75 - 30 = 45$ percent gives “unsatisfactory” (alternative C). But the 30% is John’s amount (30% of 150 = 45 questions), not 30 percentage points.
To review, see Percentage Basics.
Question 168: Three quantities related by graphs
Statement
Three quantities (I, II and III) are related to each other. The following graphs, formed by straight segments, describe the existing dependency relationships between quantities I and II, and between quantities II and III.
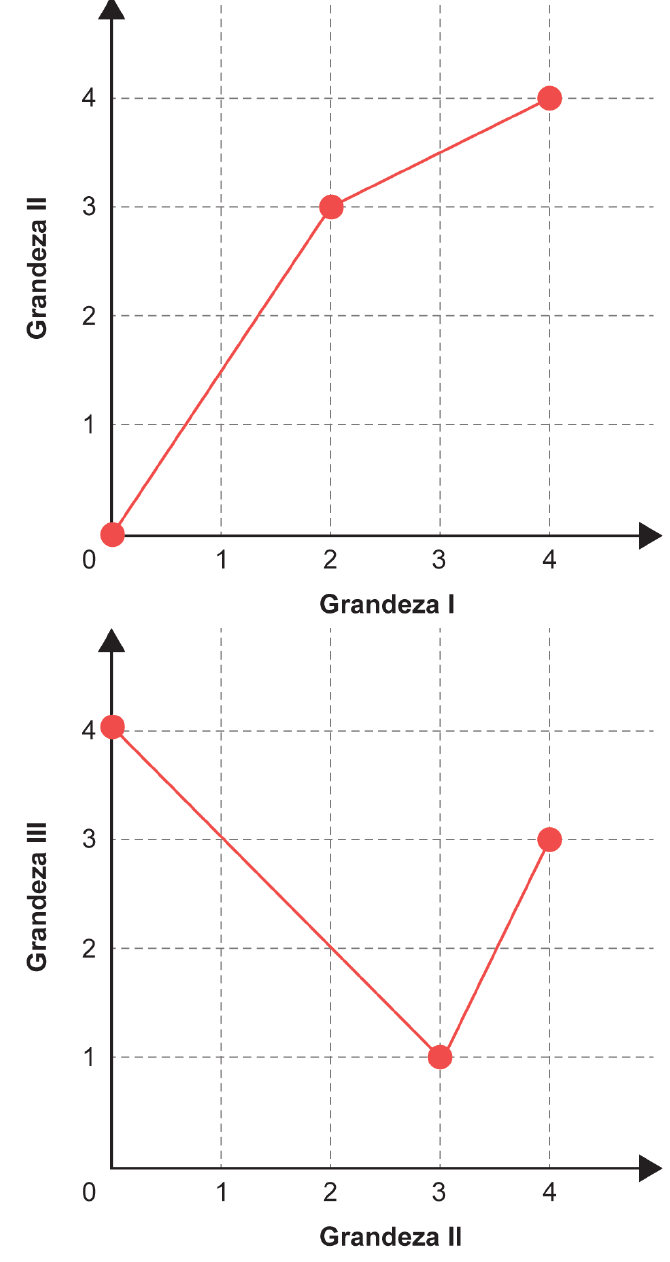
The maximum value assumed by quantity III, when quantity I varies from 1 to 3, is
- A) 1,0.
- B) 2,5.
- C) 3,0.
- D) 3,5.
- E) 4,0.
Resolution
The idea is to go in two steps: I determines II (first graph), and II determines III (second graph).
1. Values of II when I goes from 1 to 3. In the first graph:
- from $(0, 0)$ to $(2, 3)$ the segment increases 3 by 2, that is, $1{,}5$ by unit. In $I = 1$: $II = 1{,}5$;
- from $(2, 3)$ to $(4, 4)$ the segment increases 1 by 2, that is, $0{,}5$ by unit. In $I = 3$: $II = 3{,}5$.
As the graph only goes up, when I goes from 1 to 3, quantity II goes from 1,5 to 3,5.
2. Values of III when II goes from 1,5 to 3,5. In the second graph:
- from $(0, 4)$ to $(3, 1)$ the segment descends 1 by unit: $III = 4 - II$. In $II = 1{,}5$: $III = 2{,}5$. In $II = 3$: $III = 1$;
- from $(3, 1)$ to $(4, 3)$ the segment increases 2 by unit. In $II = 3{,}5$: $III = 1 + 2 \cdot 0{,}5 = 2$.
In the interval, III goes down from 2,5 to 1 and then goes up to 2.
3. Maximumis the largest of these values: $2{,}5$ (in $II = 1{,}5$, i.e. $I = 1$).
Answer: alternative B (2,5).
Be careful with the catch: the interval “from 1 to 3” is the magnitude I. Who uses 1 to 3 directly on the second graph (as if it were II) finds maximum 3,0 (alternative C). E 4,0 (alternative E) is the maximum of the second graph integer, outside the range.
To review, see First Degree Functions.
Question 169: Copy and paste figures (powers of 2)
Statement
A child, using an application, wrote a message to send to a friend. This message was written following these steps:
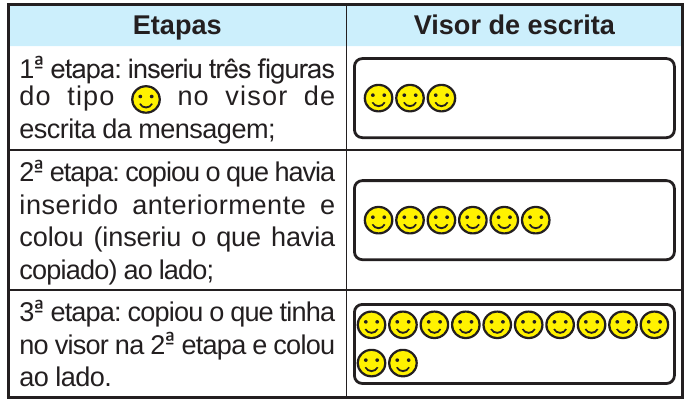
The child continued copying and pasting, at each stage, what was on the display in the immediately previous stage, until completing the 20th stage. Then he sent the message.
What was the total number of figures contained in the message sent?
- A) $3 \times 2^{19}$
- B) $3 \times 2^{20}$
- C) $3 \times 2^{21}$
- D) $3 \times 2^{20} - 1$
- E) $3 \times 2^{20} - 3$
Resolution
Copy everything and paste it next to double the number of figures.
1. Count the first steps:
| Step | Figures | Shape |
|---|---|---|
| 1ª | 3 | $3 \times 2^0$ |
| 2ª | 6 | $3 \times 2^1$ |
| 3ª | 12 | $3 \times 2^2$ |
| 4ª | 24 | $3 \times 2^3$ |
2. The default. In step $n$, the exponent of 2 is $n - 1$ (one less than the stage number, because in the 1st stage there was no duplication yet):
$$\text{figuras na etapa } n = 3 \times 2^{n-1}$$3. In the 20th stage:
$$3 \times 2^{20-1} = 3 \times 2^{19}$$Answer: alternative A ($3 \times 2^{19}$).
Be careful with the trick: $3 \times 2^{20}$ (alternative B) counts one additional duplication. There are 20 steps, but only 19 duplications: the 1st step is just insert the three figures.
To review, see Power of Integers.
Question 170: Average spending on drinks to reach profit
Statement
A concert hall will have an event whose total production cost is R$ 34 350,00, which contains 500 people. The ticket price will be R$ 130,00 and, normally, 60% of people buy half-price, paying R$ 65,00 for the ticket. In addition to revenue from ticket sales, the venue sells, with 60% profit, drinks and snacks to the public on the day of the event.
After having sold all 500 tickets, it was found that the amount of half-price tickets sold exceeded forecasts by 50%, impacting the estimated revenue from ticket sales.
On the day of the event, it was decided to maintain the percentage of 60% profit on the drinks and snacks, as everyone who bought tickets attended the show. Therefore, it is expected to make a profit of R$ 17 000,00 in this event.
In order to achieve the expected profit, the average expenditure per person on drinks and snacks, in real, should be
- A) 19,50.
- B) 28,80.
- C) 34,00.
- D) 52,00.
- E) 68,70.
Resolution
1. How many half-price tickets were sold. The forecast was 60% of 500:
$$0{,}60 \cdot 500 = 300 \text{ meias-entradas}$$The actual quantity exceeded the forecast by 50%:
$$300 \cdot 1{,}5 = 450 \text{ meias-entradas}$$Therefore, they were $500 - 450 = 50$ whole.
2. Ticket billing:
$$450 \cdot 65 + 50 \cdot 130 = 29\thinspace 250 + 6\thinspace 500 = 35\thinspace 750 \text{ reais}$$3. Profit from tickets(turnover minus production cost):
$$35\thinspace 750 - 34\thinspace 350 = 1\thinspace 400 \text{ reais}$$4. Profit that remains to come from drinks and snacks:
$$17\thinspace 000 - 1\thinspace 400 = 15\thinspace 600 \text{ reais}$$Per person: $\frac{15\thinspace 600}{500} = 31{,}20$ reais of profit.
5. Average expenditure per person. The profit on drinks and snacks is 60% of the value spent by the public. If each person spends $g$ reais:
$$0{,}60 \cdot g = 31{,}20 \quad\Rightarrow\quad g = \frac{31{,}20}{0{,}60} = 52$$Answer: alternative D (R$ 52,00).
Be careful with the catch: the half price exceeded “by 50%” the forecast: they are $300 + 150 = 450$, not $60\% + 50\% = 110\%$ from the public. And don’t forget to discount the profit that already comes from the tickets (R$ 1 400,00).
To review, see Percentage Basics.
Question 171: Solid generated by the rotation of a trapezoid
Statement
To obtain a solid of revolution (360° rotation around a fixed axis), A teacher performed the following steps:
- cut out the rectangular trapezoid $PQRS$ from a rigid material;
- attached the $PS$ side of the trapezoid to a fixed straight rod (axis of rotation);
- rotated the trapezoid 360° around the rod and obtained a solid of revolution.
Observe the figure that shows the trapezoid affixed to the stick and the direction of rotation.
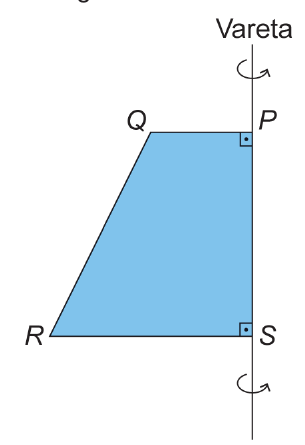
The solid obtained was a
- A) icon.
- B) cylinder.
- C) pyramid.
- D) cone frustum.
- E) pyramid trunk.
Resolution
See what each side of the trapezoid generates when rotating around $PS$:
1. Sides $PQ$ and $SR$. They are perpendicular to the axis (there are right angles at $P$ and in $S$). Each one rotates and forms a circle: $PQ$ generates the top circle, radius $PQ$; $SR$ generates the one below, with radius $SR$, which is larger.
2. Side $QR$. It is inclined with respect to the axis and generates a lateral surface that goes from the smallest to the largest circle.
3. The solid. Two parallel circular bases, of different radii, connected by an inclined surface: it is a frustum cone (a cone with the tip cut by a plane parallel to the base).
Answer: alternative D (cone trunk).
Be careful with the catch: pyramid and pyramid trunk (C and E) have faces flat and polygonal bases; a rotation always generates rounded surfaces. It would be a cylinder (B) if $PQ$ and $SR$ had the same size (rectangle), and a cone (A) if the top were a point (triangle).
Question 172: Reduction of the Maracanã field area
Statement
The Maracanã stadium underwent some structural modifications for the hosting of the 2014 World Cup, such as, for example, the dimensions of the field rectangular. To adapt to FIFA standards, the dimensions of the field were reduced from 110 m × 75 m to 105 m × 68 m.
Available on: http://virgula.uol.com.br. Accessed on: 14 Aug. 2013 (adapted).
By how many square meters was the Maracanã field area reduced?
- A) 24
- B) 35
- C) 555
- D) 1 110
- E) 1 145
Resolution
1. Old area:
$$110 \cdot 75 = 8\thinspace 250 \text{ m}^2$$2. New area:
$$105 \cdot 68 = 7\thinspace 140 \text{ m}^2$$3. Reduction:
$$8\thinspace 250 - 7\thinspace 140 = 1\thinspace 110 \text{ m}^2$$Answer: alternative D (1 110 m²).
Be careful with the catch: multiply the reductions of the sides, $5 \cdot 7 = 35$ (alternative B), does not reduce the area. And the difference between perimeters, $2 \cdot (185 - 173) = 24$ (alternative A), measures length, not area.
To review, see Rectangle, Rhombus and Square.
Question 173: Columns to divide a room
Statement
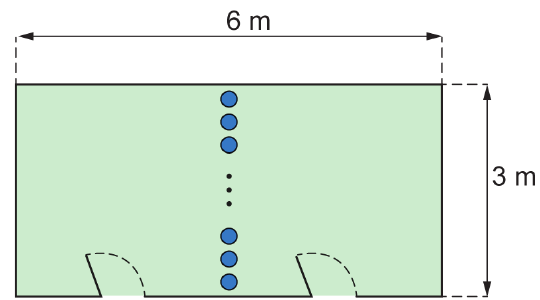
A room with a rectangular floor, with sides measuring 3 m and 6 m, will be divided into two environments. For this, columns in the format cylindrical, arranged perpendicular to the floor and represented in the figure by the blue colored circles. The centers of these circles will be on a straight line parallel to the smallest sides of the room floor. The gaps between two columns and between a column and the wall cannot be greater than 15 cm.
To purchase these columns, quotes were made based on data supplied by five stores.
| Store | Radius (cm) | Price per unit (R$) |
|---|---|---|
| I | 5 | 60 |
| II | 10 | 70 |
| III | 12 | 75 |
| IV | 15 | 90 |
| V | 20 | 120 |
The purchase will be made in the store whose budget results in the lowest total value possible.
Purchase will be made in store
- A) I.
- B) II.
- C) III.
- D) IV.
- E) V.
Resolution
1. The length to cover. The row of columns is parallel to the sides of 3 m, then crosses the room from wall to wall along $3 \text{ m} = 300 \text{ cm}$.
2. The condition. With $n$ columns of diameter $d$ there are $n + 1$ spans (one in each tip, next to the walls, and $n - 1$ between columns). Each span can have a maximum of 15 cm, so the columns plus the maximum spans need to reach 300 cm:
$$n \cdot d + 15(n + 1) \geq 300 \quad\Rightarrow\quad n \geq \frac{285}{d + 15}$$3. Lowest number of columns and cost in each store($d = 2 \cdot$ radius):
| Store | $d$ (cm) | $\frac{285}{d + 15}$ | $n$ minimum | Cost (R$) |
|---|---|---|---|---|
| I | 10 | 11,4 | 12 | $12 \cdot 60 = 720$ |
| II | 20 | 8,14 | 9 | $9 \cdot 70 = 630$ |
| III | 24 | 7,31 | 8 | $8 \cdot 75 = 600$ |
| IV | 30 | 6,33 | 7 | $7 \cdot 90 = 630$ |
| V | 40 | 5,18 | 6 | $6 \cdot 120 = 720$ |
(Example, store III: 8 columns occupy $8 \cdot 24 = 192$ cm; 108 cm are left for 9 spans, 12 cm each, within the limit. With 7 columns there would be 132 cm left for 8 spans, 16,5 cm each: above 15 cm.)
4. Lowest cost: store III, R$ 600,00.
Answer: alternative C (store III).
Be careful with the catch: the number of columns must be integer and rounded up (rounding down would leave gaps larger than 15 cm). And remember that the radius is not the diameter: each column occupies $2r$ in the queue.
Question 174: Area on the model (scale)
Statement
Architect Renzo Piano displayed the model of the new headquarters of the Whitney Museum of Art Americana, an asymmetrical building that has an open space for the gallery main area, whose area is 1 672 m².
Consider that the scale of the displayed model is 1 : 200.
Epoca, n. 682, Jun. 2011 (adapted).
The measurement of the area of the open space in this model, in square centimeters, is
- A) 4,18.
- B) 8,36.
- C) 41,80.
- D) 83,60.
- E) 418,00.
Resolution
1. Area scale. The scale 1 : 200 applies to lengths. As the area is length × length, the ratio between the areas is the square:
$$\left(\frac{1}{200}\right)^2 = \frac{1}{40\thinspace 000}$$2. Convert real area to cm². As $1 \text{ m} = 100 \text{ cm}$, $1 \text{ m}^2 = 10\thinspace 000 \text{ cm}^2$:
$$1\thinspace 672 \text{ m}^2 = 16\thinspace 720\thinspace 000 \text{ cm}^2$$3. Area in the model:
$$\frac{16\thinspace 720\thinspace 000}{40\thinspace 000} = 418 \text{ cm}^2$$Answer: alternative E (418,00 cm²).
Be careful with the catch: divide the area by 200 (and not by $200^2$) is the most common error. Another mistake is to convert m² into cm² by multiplying by 100 instead of by 10 000: this leads to 4,18 (alternative A).
To review, see Proportions and Geometry.
Question 175: Trade balance balance (line graph)
Statement
The graph shows the total value of exports and the total value of imports, over a period, in billions of dollars. The balance of the scale Brazilian trade is given by the total value of exports minus the total value of imports in the same period.
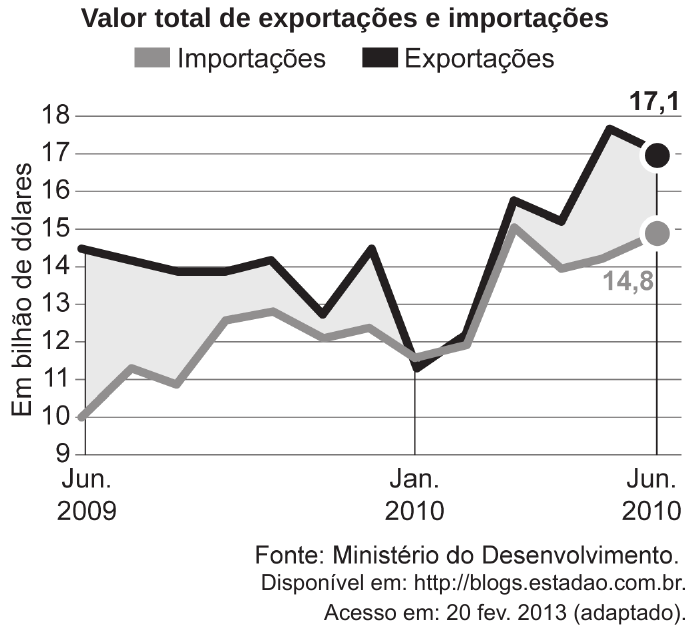
Consider that the Brazilian trade balance balances, in the three months highlighted in the graph, are represented by:
- $S_1$: balance in June 2009;
- $S_2$: balance in January 2010;
- $S_3$: balance in June 2010.
The ordering of balances $S_1$, $S_2$ and $S_3$, from largest to smallest, is
- A) $S_1$, $S_3$ e $S_2$.
- B) $S_2$, $S_1$ e $S_3$.
- C) $S_2$, $S_3$ e $S_1$.
- D) $S_3$, $S_1$ e $S_2$.
- E) $S_3$, $S_2$ e $S_1$.
Resolution
The balance is exports − imports: in the graph, it is the vertical distance from black line (exports) to the gray line (imports). It becomes positive when the black one is above.
1. Read the values (approximate, according to the graph):
| Month | Exports | Imports | Balance |
|---|---|---|---|
| Jun. 2009 ($S_1$) | ≈ 14,5 | ≈ 10 | ≈ 4,5 |
| Jan. 2010 ($S_2$) | ≈ 11,3 | ≈ 11,6 | negative (≈ −0,3) |
| Jun. 2010 ($S_3$) | 17,1 | 14,8 | 2,3 |
In January 2010 is the only point where the black line is below the gray, so the balance is negative.
2. Sort: $S_1 \approx 4{,}5 > S_3 = 2{,}3 > S_2 < 0$.
Answer: alternative A ($S_1$, $S_3$ and $S_2$).
Be careful with the catch: in June 2010 the values are the highest in the graph, but the balance is the difference, not the size of exports. Put this $S_3$ is not the largest balance (alternatives D and E).
Question 176: Decimal representation of a percentage
Statement
A research institute found that, in the last ten years, growth population of a city was 135,25%.
What is the decimal representation of the percentage rate of this growth population?
- A) 13 525,0
- B) 135,25
- C) 13,525
- D) 1,3525
- E) 0,13525
Resolution
“Percent” means “divided by 100”. Then:
$$135{,}25 \text{ por cento} = \frac{135{,}25}{100} = 1{,}3525$$Dividing by 100 is moving the decimal point two places to the left: $135{,}25 \to 1{,}3525$.
Answer: alternative D (1,3525).
Be careful with the catch: 135,25 (alternative B) is the number itself percentage, without division by 100. A rate greater than 100% generates a decimal greater than 1, which is normal: the population has more than doubled.
To review, see Percentage Basics.
Question 177: Chicken coop with the largest area (quadratic function)
Statement
A farmer intends to build a chicken coop occupying a flat area of rectangular shape, with sides of lengths $L$ meter and $C$ meter. The sides will be surrounded by screens of different types. In length sides $L$ meter, a screen whose linear meter costs R$ 20,00 will be used, while, in two other sides, one that costs R$ 15,00. The farmer wants to spend maximum, R$ 6 000,00 when purchasing all the mesh necessary for the chicken coop, and You want the chicken coop to have as much area as possible.
What will be the measurement, in meters, of the longest side of the chicken coop?
- A) 85
- B) 100
- C) 175
- D) 200
- E) 350
Resolution
1. The expense. There are two sides $L$ at R$ 20,00 the meter and two sides $C$ at R$ 15,00 per meter. For the largest area, he uses all the money:
$$2 \cdot 20L + 2 \cdot 15C = 6\thinspace 000 \quad\Rightarrow\quad 40L + 30C = 6\thinspace 000$$2. Write $L$ in terms of $C$:
$$L = \frac{6\thinspace 000 - 30C}{40} = 150 - 0{,}75C$$3. The area is a function of the 2nd degree in $C$:
$$A(C) = L \cdot C = (150 - 0{,}75C) \cdot C = 150C - 0{,}75C^2$$4. Maximum at the vertex. The parabola has downward concavity and roots $C = 0$ and $C = 200$. The vertex is at the midpoint of the roots:
$$C = \frac{0 + 200}{2} = 100$$Then $L = 150 - 0{,}75 \cdot 100 = 75$.
5. Largest side: between $C = 100$ and $L = 75$, the largest is 100 m.
(Checking the expense: $40 \cdot 75 + 30 \cdot 100 = 3\thinspace 000 + 3\thinspace 000 = 6\thinspace 000$.)
Answer: alternative B (100 m).
Be careful with the catch: $C = 200$ (alternative D) is a root of parabola, where the area is zero ($L = 0$). The maximum is in the middle, between the roots.
To review, see 2th degree equation.
Question 178: Number hunting machine (rational representations)
Statement
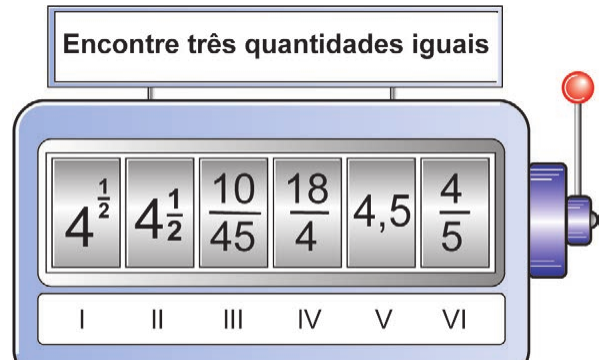
A mathematics teacher uses a “numbers machine” in her classes to check your students’ knowledge about representations of rational numbers. This machine has a display divided into six compartments and, on the side, a lever. Each student pulls the lever and waits for the compartments stop rotating. From there, you need to respond to the teacher in which positions are the numbers that represent the same quantity.
A student pulled the lever, waited for the compartments to stop rotating and observed the numbers displayed on the display. The machine configuration at that instant is shown in the image.
This student answered the teacher’s question correctly.
The positions indicated by the student were
- A) I, II and IV.
- B) II, IV and V.
- C) II, III and V.
- D) III, V and VI.
- E) III, IV and VI.
Resolution
We calculate the value of each compartment:
| Position | Number | Value |
|---|---|---|
| I | $4^{\frac{1}{2}}$ | $\sqrt{4} = 2$ |
| II | $4\frac{1}{2}$ | $4 + \frac{1}{2} = 4{,}5$ |
| III | $\frac{10}{45}$ | $\frac{2}{9} \approx 0{,}22$ |
| IV | $\frac{18}{4}$ | $\frac{9}{2} = 4{,}5$ |
| V | $4{,}5$ | $4{,}5$ |
| VI | $\frac{4}{5}$ | $0{,}8$ |
The three positions with the same value (4,5) are II, IV and V.
Answer: alternative B (II, IV and V).
Be careful with the catch: $4^{\frac{1}{2}}$ (power with exponent fractional, equal to $\sqrt{4} = 2$) is very different from $4\frac{1}{2}$ (number mixed, equal to 4,5). Whoever confuses the two marks position I (alternative A).
To review, see Nth Root.
Question 179: Cooling a mug (exponential function)
Statement
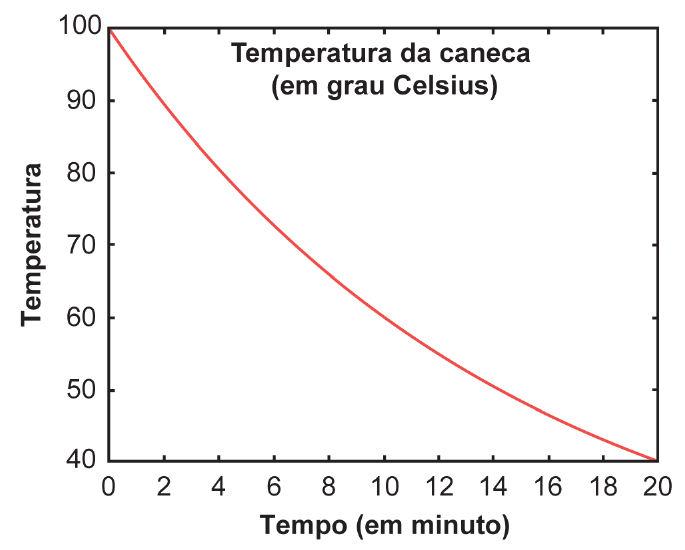
A mug of boiling water is taken from a microwave oven. A temperature $T$, in degrees Celsius, of the mug, as a function of time $t$, in minute, can be modeled by the function $T(t) = a + 80 b^t$, represented in graph below.
The values of the constants $a$ and $b$ are
- A) $a = 20; \quad b = \log(0{,}5)$
- B) $a = 100; \quad b = 0{,}5$
- C) $a = 20; \quad b = (0{,}5)^{\frac{1}{10}}$
- D) $a = 20; \quad b = \dfrac{(40)^{\frac{1}{10}}}{80}$
- E) $a = 20; \quad b = 40$
Resolution
We use two points that can be read accurately on the graph: $(0, 100)$ and $(20, 40)$.
1. In $t = 0$: any (non-zero) number raised to zero is worth 1, so
$$T(0) = a + 80 \cdot b^0 = a + 80 = 100 \quad\Rightarrow\quad a = 20$$2. In $t = 20$:
$$T(20) = 20 + 80 b^{20} = 40 \quad\Rightarrow\quad 80 b^{20} = 20 \quad\Rightarrow\quad b^{20} = \frac{1}{4}$$3. Isolate $b$ (index root 20, i.e. raise to $\frac{1}{20}$):
$$b = \left(\frac{1}{4}\right)^{\frac{1}{20}} = \left(\left(\frac{1}{2}\right)^2\right)^{\frac{1}{20}} = \left(\frac{1}{2}\right)^{\frac{2}{20}} = (0{,}5)^{\frac{1}{10}}$$(Checking the graph in $t = 10$: $T(10) = 20 + 80 \cdot (0{,}5)^{1} = 20 + 40 = 60$, which is the value shown.)
Answer: alternative C ($a = 20$ and $b = (0{,}5)^{\frac{1}{10}}$).
Be careful with the trick: alternative B exchanges $a$ for the temperature initial (100). But $T(0) = a + 80$, then $a$ is the temperature for which the mug trends with time (the environment), not the initial one.
To review, see Power with Negative Exponent and Nth Root.
Question 180: Edge of the cube with 80% of the cylinder volume
Statement
A company sells a product in cylinder-shaped packaging. straight circular, with radius measuring 3 cm, and height measuring 15 cm. This company plans to sell the same product in cube-shaped packaging, with capacity equal to 80% of the capacity of the cylindrical packaging used currently.
Use 3 as an approximate value for $\pi$.
The measurement of the edge of the new packaging, in centimeters, must be
- A) 6
- B) 18
- C) $6\sqrt{6}$
- D) $6\sqrt[3]{6}$
- E) $3\sqrt[3]{12}$
Resolution
1. Cylinder volume($V = \pi r^2 h$, with $\pi = 3$):
$$V_{cil} = 3 \cdot 3^2 \cdot 15 = 3 \cdot 9 \cdot 15 = 405 \text{ cm}^3$$2. Cube volume(80% of this):
$$V_{cubo} = 0{,}8 \cdot 405 = 324 \text{ cm}^3$$3. Edge. The volume of the cube is $x^3$:
$$x^3 = 324 \quad\Rightarrow\quad x = \sqrt[3]{324}$$4. Simplify the root. Factoring, $324 = 27 \cdot 12 = 3^3 \cdot 12$:
$$x = \sqrt[3]{3^3 \cdot 12} = 3\sqrt[3]{12} \approx 6{,}87 \text{ cm}$$Answer: alternative E ($3\sqrt[3]{12}$ cm).
Be careful with the catch: the edge of the cube comes from a cube root (volume = edge³). Alternatives with a square root or without a root do not represent $\sqrt[3]{324}$: for example, $6^3 = 216$ and $18^3 = 5\thinspace 832$.
To review, see Nth Root.