Euler's Eyes
2026-09-26
ENEM 2022 – Solved mathematics: questions 151 to 165
Source: INEP – proof and template of the 2nd day, Notebook 5 – Yellow (1st application).
The ENEM Mathematics and Technologies test 2022 was administered on the 2nd day and will from question 136 to 180. This post addresses questions 151 to 165. The numbering used here is that of the Notebook 5 – Yellow; us In other notebooks the same questions appear in a different order.
Template
| Question | Subject | Template |
|---|---|---|
| 151 | Graph reading and 2nd degree equation | E |
| 152 | Odds: World Series | C |
| 153 | Median from bar chart | D |
| 154 | Proportion: game pack | E |
| 155 | Linear system and maximization | E |
| 156 | Proportionality and percentage | C |
| 157 | Multiplicative principle | B |
| 158 | Cube planning | D |
| 159 | Checksum: remainder of division | C |
| 160 | Scale | A |
| 161 | Counting days in a tournament | B |
| 162 | Odds: bingo | E |
| 163 | Folding and symmetry | C |
| 164 | Arithmetic mean | B |
| 165 | Orthogonal projection onto the sphere | E |
Question 151: How many times does the piston speed cancel out
Statement
A machine in operation has its temperature T monitored using a graphic record over time t. This machine has a piston whose speed V varies with the temperature T of the machine, according to the expression $V = T^2 - 4$. After the machine works during the time interval of 10 hours, its operator analyzes the graphic record, shown in the figure, to assess the need for possible adjustments, knowing that the machine malfunctions when the piston speed drops.
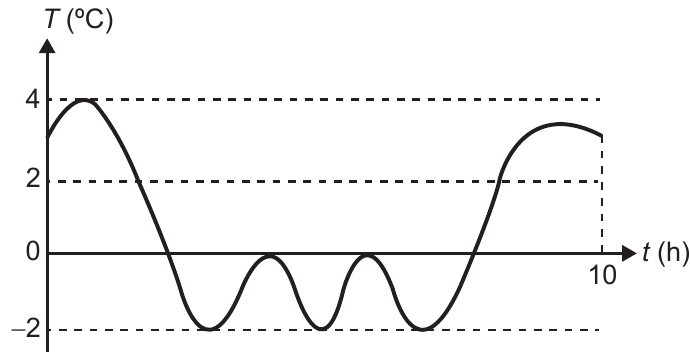
How many times did the piston speed cancel out during the 10 hours of operation? operation?
- A) 1
- B) 2
- C) 3
- D) 4
- E) 5
Resolution
1. When $V = 0$?
$$T^2 - 4 = 0 \quad\Rightarrow\quad T^2 = 4 \quad\Rightarrow\quad T = 2 \ \text{ ou } \ T = -2$$So we need to count how many times the graph passes through $T = 2$ or per $T = -2$.
2. $T = 2$ (middle dashed line). The graph starts at about 3 °C, goes up to 4, and then goes down, crossing $T = 2$ once. In the end, it goes back up and crosses $T = 2$ once again. Total: 2 times.
3. $T = -2$ (dashed line at the bottom). The graph touches this line in three vouchers. Total: 3 times.
4. Sum: $2 + 3 = 5$.
Answer: alternative E (5 times).
Be careful with the trick: whoever forgets the negative root ($T = -2$) counts only 2 times (alternative B). Who counts intersections with $T = 0$ (where the temperature is zero, not the speed) also makes mistakes.
To review, see 2th degree equation.
Question 152: Probability of the winner of the 1st game being champion
Statement
The World Series is the decision of the North American baseball championship. The two Teams that reach this stage play up to seven matches against each other. The first of those teams that complete four victories are declared champions.
Consider that, in all matches, the probability of either of the two winning teams is always $\frac{1}{2}$.
What is the probability that the winning team will be the one that won the first World Series match?
- A) $\dfrac{35}{64}$
- B) $\dfrac{40}{64}$
- C) $\dfrac{42}{64}$
- D) $\dfrac{44}{64}$
- E) $\dfrac{52}{64}$
Resolution
Call the team that won the first game X and the other Y. After the 1st game, X needs more 3 wins and Y needs 4.
1. Trick: imagine that the remaining 6 games are always played. Even if the champion is already decided, playing the extra games does not change who arrived first to 4 victories. In these 6 matches:
- if X wins 3 or more, X reaches 4 victories before (Y would have at most 3);
- if X wins 2 or less, Y wins 4 or more and is the champion.
2. Count the results. Each of the $2^6 = 64$ result strings has probability $\frac{1}{64}$. The number of sequences in which X wins exactly $k$ matches is $C_{6,k}$:
$$C_{6,3} + C_{6,4} + C_{6,5} + C_{6,6} = 20 + 15 + 6 + 1 = 42$$3. Probability:
$$P = \frac{42}{64}$$Answer: alternative C ($\frac{42}{64}$).
Be careful with the catch: forget the cases with 5 or 6 wins (or count only the sequences that end exactly on the 4th victory so wrong) leads to numbers like $\frac{35}{64}$.
To review, see Equiprobable Events.
Question 153: Median profit of a company
Statement
The graph presents the total income and expenses of a company, expressed in million reais, over the months of a given year. The company makes a profit when the difference between revenue and expenses is positive and has loss when this difference is negative.
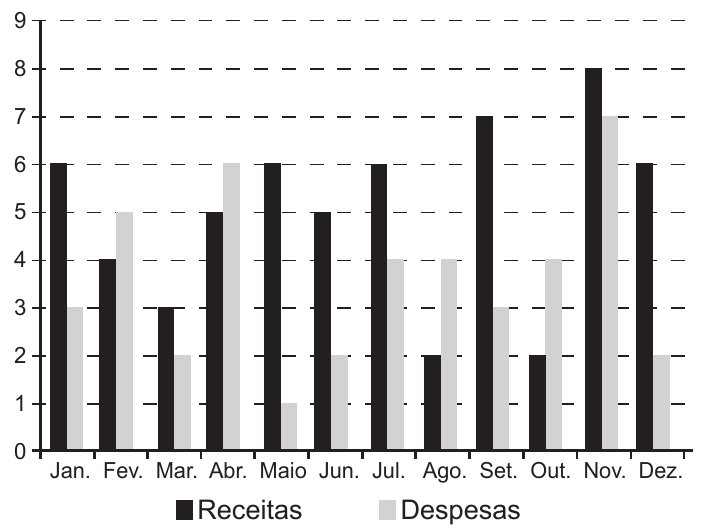
What is the median, in million reais, of the profit values determined by the company this year?
- A) 1,5
- B) 2,0
- C) 2,9
- D) 3,0
- E) 5,5
Resolution
1. Revenue − expense difference each month (in million reais):
| Month | Jan. | Feb. | Sea. | Apr. | May | Jun. | Jul. | Aug. | Sept. | Oct. | Nov. | Ten. |
|---|---|---|---|---|---|---|---|---|---|---|---|---|
| Revenue | 6 | 4 | 3 | 5 | 6 | 5 | 6 | 2 | 7 | 2 | 8 | 6 |
| Expense | 3 | 5 | 2 | 6 | 1 | 2 | 4 | 4 | 3 | 4 | 7 | 2 |
| Difference | 3 | −1 | 1 | −1 | 5 | 3 | 2 | −2 | 4 | −2 | 1 | 4 |
2. Only profits. The question is about profits, and by the definition of Profit statement is when the difference is positive. The months with a difference negative (February, April, August and October) suffered loss and are out. There are 8 values left. In order:
$$1, \quad 1, \quad 2, \quad 3, \quad 3, \quad 4, \quad 4, \quad 5$$3. Median. With 8 values (even quantity), the median is the average of the 4th and 5th terms:
$$\text{Mediana} = \frac{3 + 3}{2} = 3$$Answer: alternative D (3,0).
Be careful with the catch: include losses as “negative profits” gives 12 values, $-2, -2, -1, -1, 1, 1, 2, 3, 3, 4, 4, 5$, with median $\frac{1 + 2}{2} = 1{,}5$, alternative A.
To review, see Position Measurements.
Question 154: Gold coins in the special package (proportion)
Statement
The basic package of a smartphone game, which sells for R$ 50,00, contains 2 000 gems and 100 000 gold coins, which are items usable in this game.
The company that sells this game decided to create a special package that will be sold at R$ 100,00 and which will differ from the basic package by presenting larger quantities of gems and gold coins. To stimulate sales of this new package, the company decided to insert 6 000 additional gems in it, in relation to the that the customer would have if they chose to purchase, with the same amount, two packages basic.
The amount of gold coins that the company must add to the special package, so that the same proportion between the quantities of yolks is maintained and gold coins contained in the basic package, it is
- A) 50 000.
- B) 100 000.
- C) 200 000.
- D) 300 000.
- E) 400 000.
Resolution
1. Proportion of the basic package.
$$\frac{\text{moedas}}{\text{gemas}} = \frac{100\thinspace 000}{2\thinspace 000} = 50$$That is, 50 coins for each gem.
2. Gems from the special package. With R$ 100,00 the customer would buy two basic packages, with $2 \cdot 2000 = 4000$ gems. The special has 6 000 more:
$$4000 + 6000 = 10\thinspace 000 \text{ gemas}$$3. Special pack coins. Keeping 50 coins per gem:
$$10\thinspace 000 \cdot 50 = 500\thinspace 000 \text{ moedas}$$4. What the template considers “insert”. The value 500 000 does not appear in the alternatives. The official template is the alternative E (400 000), which corresponds to reading the special package as the basic package with items inserted, since the statement says that it “will differ from the basic package for presenting greater quantities”. The basic package already has 100 000 coins, then you need to insert
$$500\thinspace 000 - 100\thinspace 000 = 400\thinspace 000 \text{ moedas}$$Answer: alternative E (400 000).
Attention: the statement is ambiguous. If “insert” were measured relative to two basic packages (as was done for gems), the bill would be $500\thinspace 000 - 200\thinspace 000 = 300\thinspace 000$, alternative D, which is not the template official. Here we follow the INEP template. The point that doesn’t change at all reading is the total: the special package contains 10 000 gems and 500 000 coins.
To review, see Proportions.
Question 155: Laps around the park circuits (linear system)
Statement
A park has two different sized circuits for racing. A corridor train in this park and, on the first day, start your training by running 3 laps around the larger circuit and 2 turns around the smaller one, making a total of 1 800 m. Then, continuing his training, he runs more 2 laps in around the larger circuit and 1 returns around the smaller one, covering more 1 100 m.
On the second day, he intends to travel 5 000 m in the park’s circuits, doing an integer number of turns around them and so that the number of turns be as large as possible.
The sum of the number of laps around the two circuits on the second day will be
- A) 10.
- B) 13.
- C) 14.
- D) 15.
- E) 16.
Resolution
1. Size of the circuits. Let $M$ be the largest circuit and $m$ be the smallest (in meters):
From the second equation, $m = 1100 - 2M$. Replacing the first one:
$$3M + 2(1100 - 2M) = 1800 \quad\Rightarrow\quad 2200 - M = 1800 \quad\Rightarrow\quad M = 400$$e $m = 1100 - 800 = 300$.
2. Second day. We want $400a + 300b = 5000$ (i.e. $4a + 3b = 50$) with $a$ and $b$ non-negative integers and $a + b$ as large as possible. To have more laps, it is best to use the maximum number of laps on the smaller circuit.
$b$ must leave $50 - 3b$ divisible by 4:
| $b$ | $50 - 3b$ | $a$ | $a + b$ |
|---|---|---|---|
| 14 | 8 | 2 | 16 |
| 10 | 20 | 5 | 15 |
| 6 | 32 | 8 | 14 |
| 2 | 44 | 11 | 13 |
($b = 16$ would give $50 - 48 = 2$, which is not a multiple of 4.)
The highest total is $2 + 14 = 16$ turns: $2 \cdot 400 + 14 \cdot 300 = 800 + 4200 = 5000$ m.
Answer: alternative E (16 turns).
Beware of the catch: alternatives B, C and D (13, 14 and 15) also close exactly 5 000 m, but are not the largest number of turns.
Question 156: Increase in buyers with more ads
Statement
A digital marketing team was hired to increase the sales of a product offered on an e-commerce website. To this end, it created a advertisement that, when the customer clicks on it, is directed to the product sales. This advertisement was published on two social networks, A and B, and the following results were obtained:
- social network A: the ad was viewed by 3 000 people; 10% of them clicked on the ad and were redirected to the website; 3% of those clicked on the ad and bought the product. The investment made for the publication of the ad on this network was R$ 100,00;
- social network B: the ad was viewed by 1 000 people; 30% of them clicked on the ad and were redirected to the website; 2% of those clicked on the ad and bought the product. The investment made for the publication of the ad on this network was R$ 200,00.
From experience, people on the marketing team find that the amount of new people who will see the ad is directly proportional to the investment carried out, and that the number of people who will buy the product will also will remain proportional to the number of people who click on the ad.
The person responsible for the product then decided to invest more R$ 300,00 in each of the two social networks to publicize this advertisement and, in fact, obtained the expected proportional increase in the number of customers who purchased this product. To classify the increase in the number (Q) of buyers of this product, as a result of this second disclosure, in relation to the results observed in the first disclosure, the person responsible for the product adopted the following criteria:
- Q ≤ 60%: not satisfactory;
- 60% < Q ≤ 100%: regular;
- 100% < Q ≤ 150%: good;
- 150% < Q ≤ 190%: very good;
- 190% < Q ≤ 200%: excellent.
The increase in the number of buyers, as a result of this second disclosure, in relation to what was recorded with the first disclosure, was classified as
- A) not satisfactory.
- B) regular.
- C) good.
- D) very good.
- E) excellent.
Resolution
1. First disclosure.
- Network A: $3000 \cdot 10\% = 300$ clicks; $300 \cdot 3\% = 9$ buyers.
- Network B: $1000 \cdot 30\% = 300$ clicks; $300 \cdot 2\% = 6$ buyers.
Total: $9 + 6 = 15$ buyers.
2. Second disclosure (R$ 300,00 on each network). Everything is proportional to the investment:
- Network A: investment $\frac{300}{100} = 3$ times greater ⇒ $3 \cdot 9 = 27$ buyers.
- Network B: investment $\frac{300}{200} = 1{,}5$ increasing ⇒ $1{,}5 \cdot 6 = 9$ buyers.
Total: $27 + 9 = 36$ buyers.
3. Percentage increase. In relation to 15 from the first release:
$$Q = \frac{36 - 15}{15} = \frac{21}{15} = 1{,}4 = 140\%$$As $100\% < 140\% \le 150\%$, the increase is classified as good.
Answer: alternative C (good).
Beware of the catch: $\frac{36}{15} = 240\%$ is the ratio between quantities, not the increase. The increase is $240\% - 100\% = 140\%$.
To review, see Percentage Basics.
Question 157: Minimum number of colors (multiplicative principle)
Statement
A car manufacturer announced that it offers its customers more than 1 000 different car configurations, varying the model, engine, options and the color of the vehicle. Currently, it offers 7 car models with 2 engine types: 1.0 and 1.6. Regarding options, there are 3 choices possible: multimedia center, light alloy wheels and leather seats, with the possibility of customer choose to include one, two, three or none of the available options.
To be faithful to the disclosure made, the minimum number of colors that the manufacturer must make available to its customers is
- A) 8.
- B) 9.
- C) 11.
- D) 18.
- E) 24.
Resolution
1. Options. Each of the 3 options can be included or not (2 choices for each), which gives $2 \cdot 2 \cdot 2 = 8$ optional combinations (including “none”). Checking: $C_{3,0} + C_{3,1} + C_{3,2} + C_{3,3} = 1 + 3 + 3 + 1 = 8$.
2. Settings without counting color. By the multiplicative principle:
$$7 \cdot 2 \cdot 8 = 112$$3. Colors. With $n$ colors are $112n$ settings. We need more than 1 000:
$$112n > 1000 \quad\Rightarrow\quad n > 8{,}93$$With 8 colors would just be $112 \cdot 8 = 896$; with 9 colors, $112 \cdot 9 = 1008$.
Answer: alternative B (9 colors).
Be careful with the trick: who counts the optionals as 3 (one of each time) or forget the “none” option, you get fewer settings and need more colors, such as 24 (alternative E, with $7 \cdot 2 \cdot 3 = 42$ and $\frac{1000}{42} \approx 23{,}8$).
Question 158: Planning a cube with painted squares
Statement
Among the various possible layouts for the cube, one of them is the one that is shown in Figure 1.
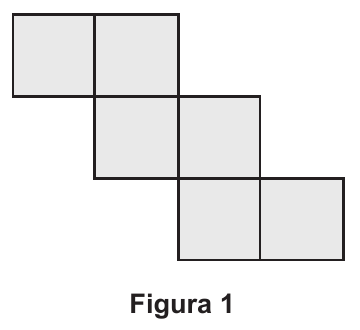
In a cube, gray squares were painted on three of its sides. dark, which occupy a quarter of these faces, with these three squares a vertex in common, as illustrated in Figure 2.
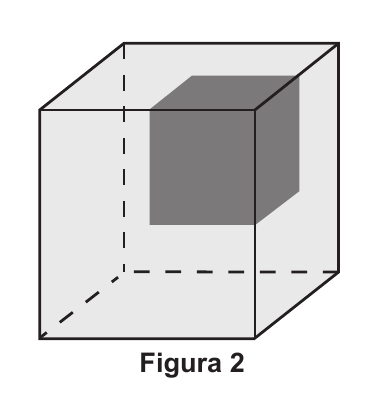
The layout of the cube in Figure 2, according to the type of layout presented in Figure 1, it is
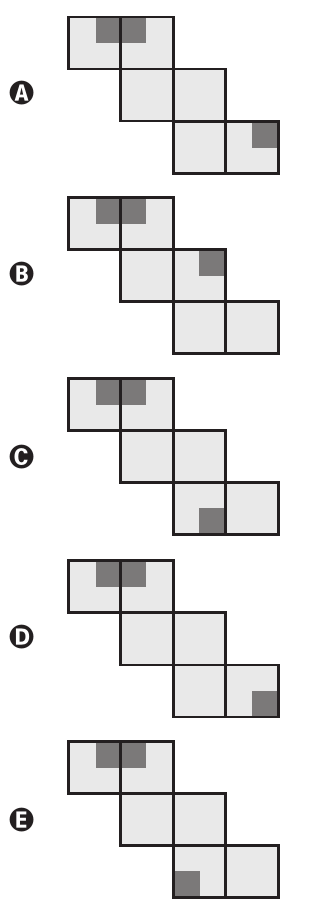
Resolution
Number the faces of Figure 1 as a ladder: 1 and 2 in top row, 3 and 4 in the middle, 5 and 6 in the bottom (left) to the right).
In all alternatives, the comics for the faces 1 and 2 are already drawn together, touching the top corner of the edge that separates 1 from 2. Call this corner of V: it is the vertex common to the three squares. Need to find out where it is the third square.
1. Opposite faces. In this ladder layout, when assembling the cube, the opposite the faces 1 and 4, 2 and 5, 3 and 6 (each face is opposite the one is “one and a half houses” further up the stairs). The third square must be in a neighboring face of 1 e of 2, then it cannot be on the face 4 (opposite 1) nor at 5 (opposite to 2). This eliminates B (face 4) and C and E (face 5).
2. Face 3 or face 6? The edge between 1 and 2 has two endpoints. The bottom one is the point where 1, 2 and 3 meet in the pattern itself. So V, the extreme from above, it is the vertex of 1, 2 and 6.
3. Which corner of the face 6? When closing the cube, the two ends of the ladder come together. meet: the top edge of face 1 sticks to the bottom edge of face 6, and the top edge of face 2 sticks to the right edge of face 6. The vertex V, which is the end of these two edges, will stop at the bottom right corner of the face 6.
This is alternative D. (It’s worth checking by cutting out the plan in a paper and assembling the cube.)
Answer: alternative D.
Be careful with the trick: alternative A also puts the square on the face 6, but in the upper right corner, which is a vertex of the faces 2, 5 and 6, and not the common vertex with face 1.
Question 159: Bank branch check digit
Statement
Each number that identifies a bank branch has four digits: N1, N2, N3, N4 plus a check digit N5.
$$\boxed{N_1}\boxed{N_2}\boxed{N_3}\boxed{N_4} - \boxed{N_5}$$All these digits are natural numbers belonging to the set {0, 1, 2, 3, 4, 5, 6, 7, 8, 9}. To determine N5, firstly Multiply the first four digits of the agency number in order by 5, 4, 3 and 2, respectively, add the results and obtain $S = 5N_1 + 4N_2 + 3N_3 + 2N_4$.
Subsequently, the remainder of the division of S by 11 is found, denoting by R this rest. In this way, N5 is the difference 11 − R.
Consider the number of a bank branch whose first four digits are 0100.
What is the check digit N5 from this bank branch?
- A) 0
- B) 6
- C) 7
- D) 8
- E) 9
Resolution
1. The digits. 0100 gives $N_1 = 0$, $N_2 = 1$, $N_3 = 0$, $N_4 = 0$.
2. The sum $S$.
$$S = 5 \cdot 0 + 4 \cdot 1 + 3 \cdot 0 + 2 \cdot 0 = 4$$3. The rest. $4 = 0 \cdot 11 + 4$, then $R = 4$ (like $S < 11$, the rest is $S$ itself).
4. The digit: $N_5 = 11 - 4 = 7$.
Answer: alternative C (7).
Be careful with the catch: the weight 4 is the second digit. Who applies the weights in the wrong order (e.g. 2, 3, 4, 5) finds $S = 3$ and $N_5 = 8$ (option D).
To review, see Division.
Question 160: Refrigerator in the kitchen plan (scale)
Statement
A couple is renovating their kitchen and decided to buy a refrigerator. new. Observing the plan of the new kitchen, drawn to the scale of 1 : 50, noticed that the space for the refrigerator was 3,8 cm high and 1,6 cm wide. They know that refrigerator manufacturers indicate that for good functioning and easy cleaning, these appliances must be placed in spaces that allow a distance of at least 10 cm in other furniture or walls, both on the top and sides. The couple bought a refrigerator that would fit in the space allocated for it in the new kitchen, following the manufacturer’s instructions.
This refrigerator has a maximum height and width, in meters, respectively, equal to
- A) 1,80 e 0,60.
- B) 1,80 e 0,70.
- C) 1,90 e 0,80.
- D) 2,00 e 0,90.
- E) 2,00 e 1,00.
Resolution
1. Actual measurements of the space. On the scale 1 : 50, each 1 cm of the plan is worth 50 real cm:
- height: $3{,}8 \cdot 50 = 190$ cm;
- width: $1{,}6 \cdot 50 = 80$ cm.
2. Clearances. At the time, there is only clearance at the top (10 cm). In width, there is clearance on two sides ($2 \cdot 10 = 20$ cm):
- maximum height: $190 - 10 = 180$ cm $= 1{,}80$ m;
- maximum width: $80 - 20 = 60$ cm $= 0{,}60$ m.
Answer: alternative A (1,80 m and 0,60 m).
Be careful with the trick: deduct only 10 cm from the width (forgetting that there are two sides) gives 0,70 m, alternative B. Do not take any slack gives alternative C (the measurements of the space, not the refrigerator).
Question 161: Minimum duration of a football tournament
Statement
32 teams were invited to a football tournament, which were divided into 8 groups with 4 teams, and within a group, each team competes for a single match against each of the other teams in their group. The first and the The runners-up in each group go on to play the 8 matches of the next phase of the tournament, called round of 16. The winners of the matches Round of 16 moves on to play the 4 quarter-final matches. The winners of the quarter-finals play in the 2 semi-final matches, and the winners advance to the grand final, which defines the tournament champion.
According to tournament rules, each team must have a rest period of, at minimum, 3 days between two games played by it, that is, if a team play a match, for example, on a Sunday, you can only play the match following Thursday of the same week.
The minimum number of days required to hold this tournament is
- A) 22.
- B) 25.
- C) 28.
- D) 48.
- E) 64.
Resolution
1. How many games does the champion play. In the group stage, each team faces the others 3 from the group: 3 games. Then come the round of 16, quarterfinals, semifinals and final: 4 games. The champion plays $3 + 4 = 7$ matches, one after the other.
2. Interval between games. Using the example of the statement, whoever plays on Sunday only returns on Thursday: the day of the game and the next game are 4 days apart (day 1, then day 5, day 9…).
3. Can you play all the matches in a round on the same day? Yes. group of 4 teams (A, B, C, D), each round has 2 games with 4 teams (A×B and C×D; A×C and B×D; A×D and B×C). Then the 8 groups play each round on a same day, and the same goes for each knockout stage.
4. Minimum calendar:
| Phase | Day |
|---|---|
| 1st round of groups | 1 |
| 2nd round | 5 |
| 3rd round | 9 |
| Octaves | 13 |
| Wednesdays | 17 |
| Semifinals | 21 |
| End | 25 |
In general, the 7th game falls on day $1 + 6 \cdot 4 = 25$.
Answer: alternative B (25 days).
Beware of the catch: “3 days of rest” is not “a game every 3 days.” The 3 rest days are between the two game days.
Question 162: Probability of winning at bingo
Statement
In a bingo game, the cards contain 16 squares arranged in lines and columns. Each square has a number printed, among the integers from 1 to 50, no repetition of number. In the first round, a number is drawn, randomly, among the 50 possible. In all rounds, the number drawn is discarded and does not participate in the draws for the following rounds. If the player have the drawn number on your card, he marks it on the card. Win the player who first manages to fill in four squares that form a line, a column or a diagonal, depending on the types of situations illustrated in Figure 1.
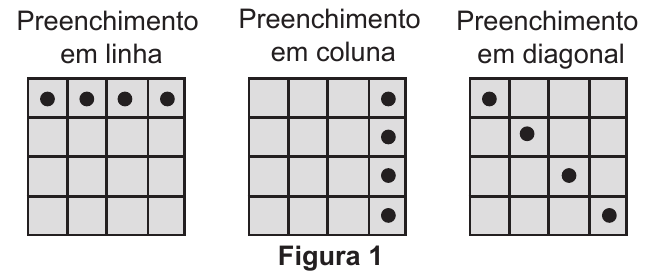
The game starts and, in the first four rounds, the following were drawn numbers: 03, 27, 07 and 48. At the end of the fourth round, only Pedro had a card that contained these four drawn numbers, with all the others Players were able to mark at most one of these numbers on their cards. Observe in Figure 2 Pedro’s card after the first four rounds.
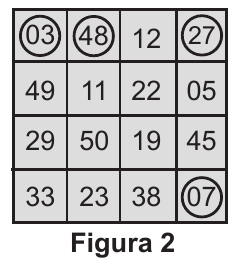
The probability that Pedro wins the game in one of the next two rounds is
- A) $\dfrac{1}{46} + \dfrac{1}{45}$
- B) $\dfrac{1}{46} + \dfrac{2}{46 \times 45}$
- C) $\dfrac{1}{46} + \dfrac{8}{46 \times 45}$
- D) $\dfrac{1}{46} + \dfrac{43}{46 \times 45}$
- E) $\dfrac{1}{46} + \dfrac{49}{46 \times 45}$
Resolution
After 4 draws, there are $50 - 4 = 46$ numbers left in the ballot box. The others players have at most 1 number marked, so in 2 rounds they cannot complete 4: only Pedro can win.
1. Where Pedro is close to winning. Marked: 03, 48 and 27 (1st line) and 07 (bottom right corner).
- 1st line (03, 48, 12, 27): only 12 is missing.
- Main diagonal (03, 11, 19, 07): 11 and 19 are missing.
- 4th column (27, 05, 45, 07): 05 and 45 are missing.
- The other rows, columns and the other diagonal need 3 or more numbers.
2. Win in the 5th round. Only if 12 comes up:
$$P_1 = \frac{1}{46}$$3. Win in the 6th round (without having won in the 5th). There are two ways:
- 12 comes out in the 6th round, after a different number of 12 in the 5th: $\frac{45}{46} \cdot \frac{1}{45} = \frac{45}{46 \times 45}$.
- The two missing numbers on the diagonal or in the column are output, in any order: (11, 19), (19, 11), (05, 45) or (45, 05). Each sequence has probability $\frac{1}{46} \cdot \frac{1}{45}$, then add $\frac{4}{46 \times 45}$.
4. Total(cases do not overlap):
$$P = \frac{1}{46} + \frac{49}{46 \times 45}$$Answer: alternative E.
Be careful with the prank: who forgets the chance of 12 leaving only in the 6th round is left with $\frac{1}{46} + \frac{4}{46 \times 45}$, which is not among the alternatives; whoever forgets the column is left with alternative B.
To review, see Equiprobable Events.
Question 163: Cutout in folded paper (symmetry)
Statement
The art teacher instructed his students to perform the following sequence of activities:
- Fold a sheet of paper into a square shape twice, in sequence, along the dashed lines, as illustrated in figures 1 and 2, to obtain the folded paper, as shown in Figure 3.
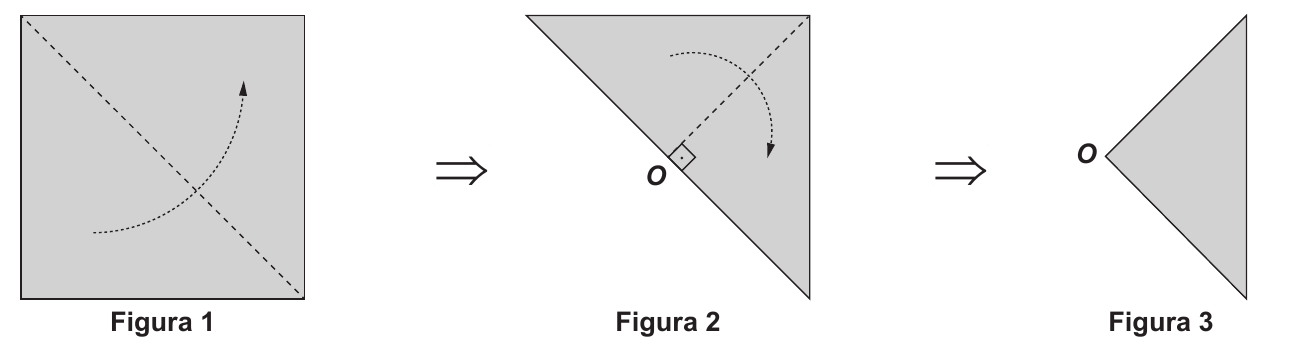
- Then, on the folded paper in Figure 3, consider the point R, on the segment OM, with M being the midpoint of the side of the original square, so than $OR = \frac{1}{4}OM$, draw a circular arc with a radius measuring $\frac{1}{2}OM$ with center at the point R, obtaining Figure 4. Lastly, cut the paper along the circumference arc and exclude the part that contains the circular sector, obtaining the folded paper, as shown in Figure 5.
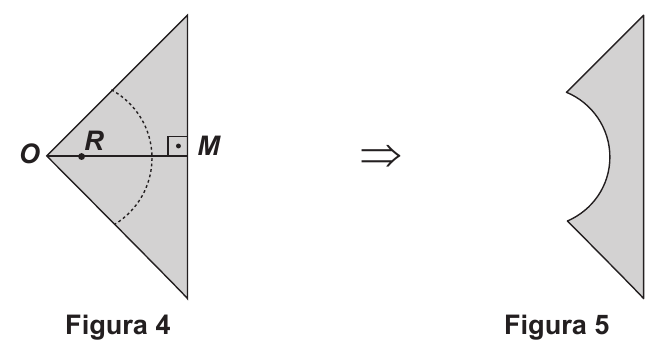
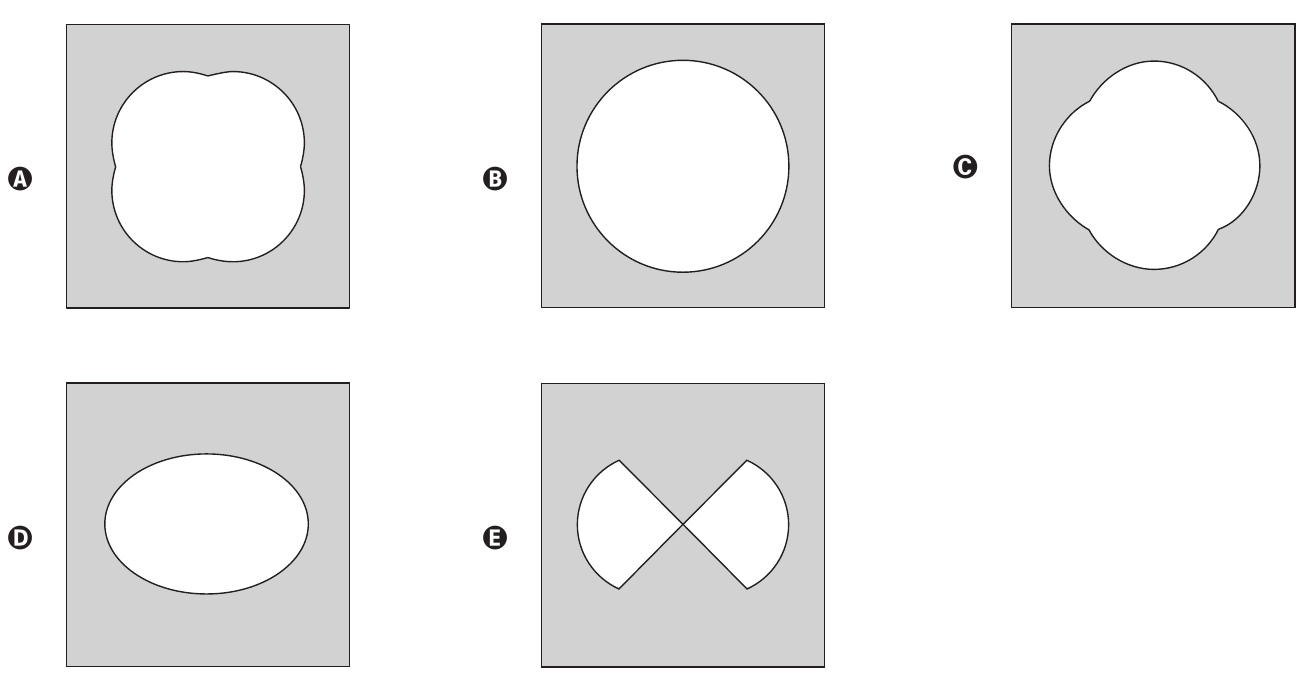
After unfolding the paper that remained in Figure 5, the flat figure that the students will get
Resolution
1. What is folded paper. Two folds along the diagonals leave the square in 4 layers: Figure 3 is a quarter of the square, the triangle with vertex in the center $O$ and with the side $OM$ going to the midpoint $M$ on one side. Ao unfold, this triangle appears 4 times, once facing each side of the square.
2. The cutout in a triangle. The center of the arc, $R$, is over $OM$ $\frac{1}{4}OM$ from $O$, and the radius is $\frac{1}{2}OM$. Then:
- in the direction of $M$, the arc reaches $\frac{1}{4} + \frac{1}{2} = \frac{3}{4}$ from $OM$, far from $O$;
- At the edges of the triangle (the diagonals of the square), the arc comes closest of $O$, because these edges are inclined 45° with respect to $OM$.
Each cut piece is “rounded” and longer in the direction of the point average of one sideof the square.
3. Unfolding. The final hole is formed by 4 circular arcs, each pointing to the midpoint of one side (top, bottom, left and right). on the right). Where two neighboring arcs meet, on the diagonals, a “beak” is formed inside. It is the figure of four lobes facing the sides, with recesses on the diagonals.
Answer: alternative C.
Be careful with the catch: alternative A also has four lobes, but facing the corners of the square (the recesses are in the middle of the sides). This would happen if the center $R$ was on a diagonal, and not about $OM$.
Question 164: Life expectancy in 2014 (arithmetic mean)
Statement
Life expectancy at birth is the average number of years that an individual tends to live live from birth, considering population data. In Brazil, This number has been increasing considerably, as shown in the graph.
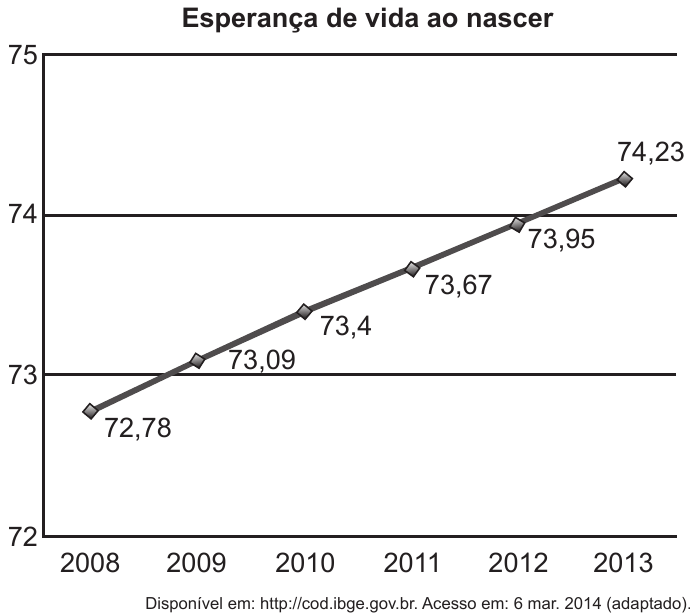
It can be seen that life expectancy at birth in 2012 was exactly the same as average of those recorded in the years 2011 and 2013. Suppose this fact also occurred with life expectancy at birth in 2013, in relation to life expectancy at birth life of 2012 and 2014.
If the assumption made has been confirmed, life expectancy at birth in Brazil in the year 2014 will have been, in years, equal to
- A) 74,23.
- B) 74,51.
- C) 75,07.
- D) 75,23.
- E) 78,49.
Resolution
1. Checking the fact that 2012. $\frac{73{,}67 + 74{,}23}{2} = \frac{147{,}90}{2} = 73{,}95$. In fact, it is the value from 2012.
2. The same relationship for 2013. Let $x$ be the life expectancy of 2014:
$$74{,}23 = \frac{73{,}95 + x}{2} \quad\Rightarrow\quad x = 2 \cdot 74{,}23 - 73{,}95 = 148{,}46 - 73{,}95 = 74{,}51$$Note that this is the same as continuing to add the increase of 0,28 year by year: $73{,}67 \to 73{,}95 \to 74{,}23 \to 74{,}51$.
Answer: alternative B (74,51).
Be careful with the catch: alternative A (74,23) is the value of 2013, and not that of 2014.
To review, see Position Measurements.
Question 165: Projection of trajectories on the globe
Statement
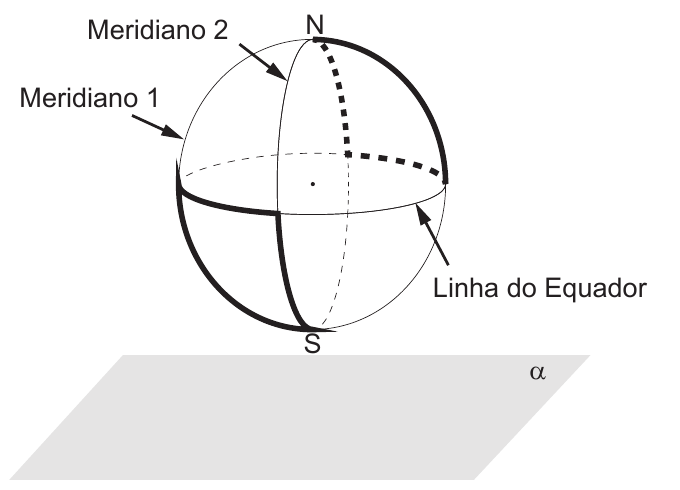
The figure highlights two trajectories on the surface of the globe terrestrial, described when covering part of the meridians 1, 2 and the Line of Equator, with the meridians 1 and 2 contained in perpendicular planes each other. The α plane is parallel to the one containing the Equator.
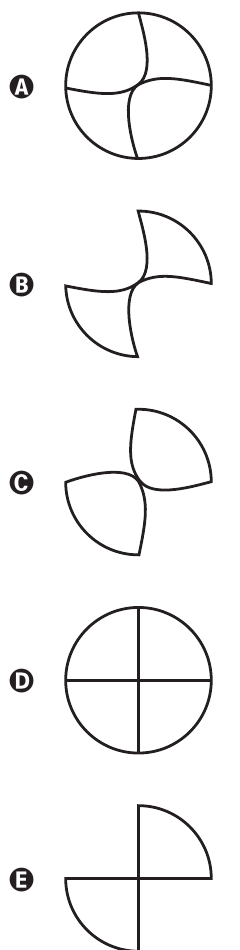
The top view of the orthogonal projection onto the α plane of these two trajectories is
Resolution
Looking at the orthogonal projection on α “from above” is the same as looking at the globe from above. from the North Pole. In this view:
- the Equator appears as the contour circle;
- each meridian is in a vertical plane that passes through the N–S axis, so appears as a straight segment (a diameter); the N and S poles fall into the center;
- as the planes of the meridians 1 and 2 are perpendicular, these two diameters are perpendicular and divide the circle into 4 quadrants.
1. Trajectory from above (northern hemisphere). Leaves N, descends along the meridian 2 (back) to the Equator, walk a quarter of the Equator to the meridian 1 (right side) and climb it to N. In the projection: a ray, a quarter circumference and another radius, that is, a sector of 90° (a quarter of circle), in the back and right quadrant.
2. Trajectory from below (southern hemisphere). Connects, through the Equator, the point of meridian 1 on the left side to the point of meridian 2 on the front, and descends through these meridians to S. In the projection: another quarter of a circle, in the quadrant of front and left.
3. Joining. Two quarter circles in opposite quadrants, which touch only in the center. In the top view (back up, front down), one is in top right and the other bottom left.
Answer: alternative E.
Be careful with the catch: alternatives A, B and C draw the meridians like curves. Seen from above, a meridian is “in profile” and projects as straight segment. Alternative D shows the entire meridians and equator, and not just the trajectories.