
Euler's Eyes
2026-10-14
Chladni figures and the prize for vibrating plates
Sprinkle sand on a metal plate held at its centre and draw a violin bow across the edge. The plate begins to sing, and the sand, as if it had a will of its own, flees some places and gathers in others, drawing lines, crosses, stars and symmetrical curves. Change the note, and the drawing changes. These are Chladni figures.
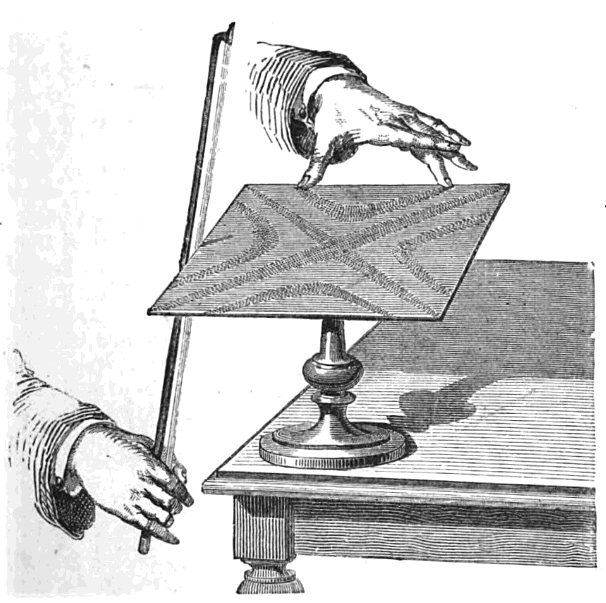
Sound made visible
The German Ernst Chladni published these figures in 1787, in a book called Discoveries on the Theory of Sound. The qualitative explanation is simple. When the plate vibrates, almost all its points move up and down and throw the sand away. But some lines stay still: these are the nodal lines. The sand slides there and stays. The drawing is a map of the places where the plate does not move.
Chladni travelled around Europe showing his plates. In 1808 he presented them in Paris to Napoleon, who was fascinated and offered the Academy of Sciences a one-kilogram gold medal for whoever could give a mathematical theory of elastic surfaces that explained the figures.
Why it was so hard
For a vibrating string the mathematics was already in place. In 1747 d’Alembert had written down the equation of the string, and Euler and Daniel Bernoulli had explained that it vibrates in notes whose frequencies are multiples of the lowest: $f, 2f, 3f, \ldots$ A string is a line, and the force pulling it back depends on how much it is tilted.
A plate is different. It resists being bent, like a metal ruler, and it bends in two directions at once. Euler had tried to treat bells, and Jakob Bernoulli, Daniel’s nephew, had imagined the plate as a grid of crossed beams, without success. Lagrange, a member of the jury, thought the methods of the day were not enough. Only one person entered.
Three attempts
Sophie Germain started from a hypothesis: the force with which the plate resists is proportional to its curvature, and on a surface this means adding the curvatures in the two principal directions. In 1811 she submitted her paper. There were errors in the calculations, and the prize was not awarded. But Lagrange, correcting the calculations from her hypothesis, arrived at the right equation for the small displacements $z(x,y,t)$ of the plate:
$$\begin{aligned}&\frac{\partial^2 z}{\partial t^2}+k^2\Bigg(\frac{\partial^4 z}{\partial x^4}+2\,\frac{\partial^4 z}{\partial x^2\,\partial y^2}\\&\qquad\qquad+\frac{\partial^4 z}{\partial y^4}\Bigg)=0.\end{aligned}$$Notice the fourth-order derivatives. For the string, the equation has only second derivatives. The higher order is the mark of resistance to bending.
The competition was reopened. In 1813 Sophie showed that the equation reproduced several of Chladni’s figures and received an honourable mention. In 1816, the third time, she won the prize. The jury still pointed to gaps in the physical justification and in the conditions at the edge of the plate, which were only settled in 1850 by Gustav Kirchhoff. But the equation, now written as $\frac{\partial^2 z}{\partial t^2}+k^2\,\Delta^2 z=0$, is the same one engineers still use today to design floors, wings and guitar tops.
Drawing the figures
For a square plate, a classical approximation of the nodal lines is given by combinations like
$$\cos(n\pi x)\cos(m\pi y)\pm\cos(m\pi x)\cos(n\pi y)=0,$$with $x$ and $y$ between 0 and 1. The figure below was drawn with this formula: each square is a plate, and the light lines are where the sand would collect.
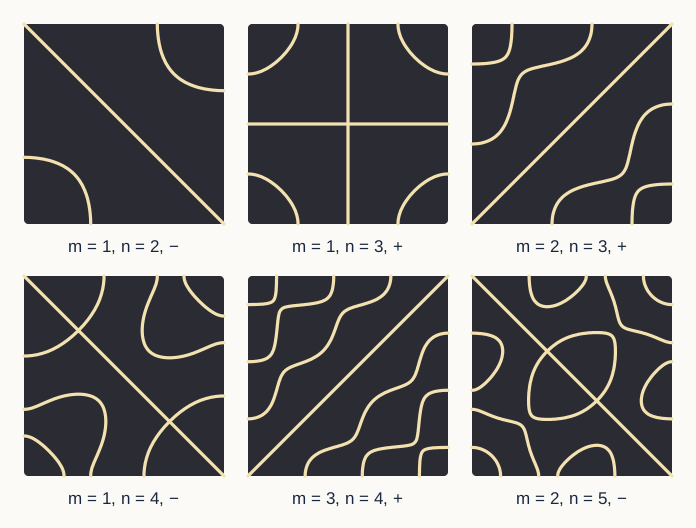
Exercise: show that the diagonal x = y is a nodal line for m = 1, n = 2 with the minus sign
The expression is $\cos(2\pi x)\cos(\pi y)-\cos(\pi x)\cos(2\pi y)$. On the diagonal, $y=x$, it becomes $\cos(2\pi x)\cos(\pi x)-\cos(\pi x)\cos(2\pi x)=0$. So the whole diagonal stays still, as the first square of the figure shows.
Exercise: a plate is replaced by another of the same material and thickness, but with twice the side. What happens to the notes?
In the plate equation, time appears with a second derivative and space with a fourth derivative. If distances double, the fourth derivatives become $2^4=16$ times smaller, and to compensate, the second derivatives in time must also become 16 times smaller: the duration of each oscillation becomes $4$ times longer. The frequencies drop to $\frac14$, that is, two octaves lower. For a string, doubling the length lowers the note by only one octave.
Sources: Louis L. Bucciarelli and Nancy Dworsky, Sophie Germain: An Essay in the History of the Theory of Elasticity (1980) · Ernst Chladni, Entdeckungen über die Theorie des Klanges (1787) · biography of Sophie Germain, MacTutor.
All Sophie Germain topics · ← The Sophie Germain identity: factoring what looks prime · Mean curvature: how much a surface bends →