
Euler's Eyes
2026-10-13
Formula, table and graph: treatment and conversion
When Descartes published La Géométrie in 1637, he invented neither curves nor equations. Both had existed for centuries. What he invented was a bridge between them: a way of turning every curve into an equation and every equation into a curve, by measuring distances from a reference line (the two perpendicular axes we now call Cartesian became established only after him). The Cartesian plane is, above all, a machine for translating from one script into another.
This translation is so familiar that we forget how hard it is. The Frenchman Raymond Duval spent his life studying why so many pupils who calculate well freeze in front of a graph, and arrived at an idea that is now central to mathematics education.
Registers of representation
Duval calls a register of representation a system of signs with its own rules: the Portuguese or English language, algebraic writing, tables, Cartesian graphs, geometric figures. One and the same object, such as the function that doubles and adds one, appears in all of them:
- in words: “for each input, the output is double plus one”;
- as a formula: $f(x)=2x+1$;
- as a table: the pairs $(0,1)$, $(1,3)$, $(2,5)$;
- as a graph: a line that cuts the vertical axis at $1$ and rises $2$ for every $1$ it moves along.
Move the figure below and follow the same point in the three registers:
No register is a copy of the others. The formula is best for computing $f(100)$. The table shows concrete cases, but only some. The graph shows at a glance that the function grows, and by how much. The words say what we are talking about. Each lights up one part of the object and leaves another in the dark.
Treating and converting
Duval’s most useful distinction separates two activities that look alike and are not.
A treatment is a transformation within a register. Solving an equation is an algebraic treatment:
$$2x+1=7\iff 2x=6\iff x=3.$$Simplifying a fraction, factorising a polynomial and adding up columns of a table are also treatments. They follow the rules of the register itself, and school trains this kind of task very well.
A conversion is a passage from one register to another: from formula to graph, from sentence to equation, from table to formula. To draw the graph of $f(x)=2x+1$ you need to know that the $1$ becomes the point where the line cuts the vertical axis and that the $2$ becomes the slope. No algebraic rule teaches this; you have to know how the two registers correspond.
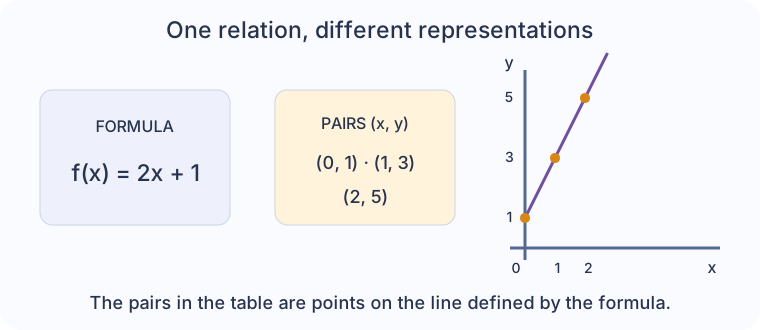
The table above gives three points. Why may we join them with a straight line? Not because of the points: three aligned points also fit on infinitely many wiggly curves. We may join them because the formula says the function is affine. The conversion from table to graph depends on information only the formula had.
Conversions that deceive
Duval noticed that some conversions are easy and others very hard, and that the difficulty depends on whether the two scripts run in the same order or not. Compare two sentences:
- “The set of points whose ordinate equals the abscissa.” It becomes $y=x$, word for word, in the same order. An easy conversion.
- “The set of points whose ordinate is greater than the abscissa.” It becomes $y>x$, and the graph is the half-plane above the line $y=x$. Many pupils shade the region below, or just the line.
In the second sentence, the word “greater” has to become a region and a side, something the word does not say. Duval calls conversions in which the units of one script do not correspond one to one with those of the other non-congruent. They are what separates those who have memorised procedures from those who understand the object.
An activity in the three registers
Consider the statement: “the square of a real number is equal to four.”
- As a formula: $x^2=4$.
- By treatment: $x^2=4\iff x=2$ or $x=-2$.
- As a graph: the solutions are the abscissas of the points where the parabola $y=x^2$ crosses the horizontal line $y=4$, that is, $(-2,4)$ and $(2,4)$.
The graph shows at a glance something the formula hides: a horizontal line above the vertex of the parabola always cuts it at two symmetric points. From this you can see, without any calculation, that $x^2=c$ has two solutions when $c>0$, one when $c=0$ and no real one when $c<0$.
Exercise: treatment or conversion?
- Writing $2x+2$ as $2(x+1)$: treatment (algebra to algebra).
- Drawing the graph of $y=2(x+1)$: conversion (algebra to graph).
- Making a table of $y=2(x+1)$ for $x=0,1,2$: conversion (algebra to table), giving $2$, $4$, $6$.
- Adding up the values in the table: treatment (within arithmetic), giving $12$.
Exercise: from sentence to half-plane
Draw “the set of points whose ordinate is less than twice the abscissa”. The sentence becomes $y<2x$. Draw the line $y=2x$ dashed (because points on it do not satisfy the strict inequality) and shade the region below it. Test with a point: $(1,0)$ gives $0<2$, true, and $(1,0)$ is below the line. Testing with a concrete point is the best defence against a non-congruent conversion.
To go further, see Duval’s article A cognitive analysis of problems of comprehension in a learning of mathematics (2006).
Chapter index · ← Square root: the side of the square and the sign that forgot · How to read a notation: a guide and a glossary →