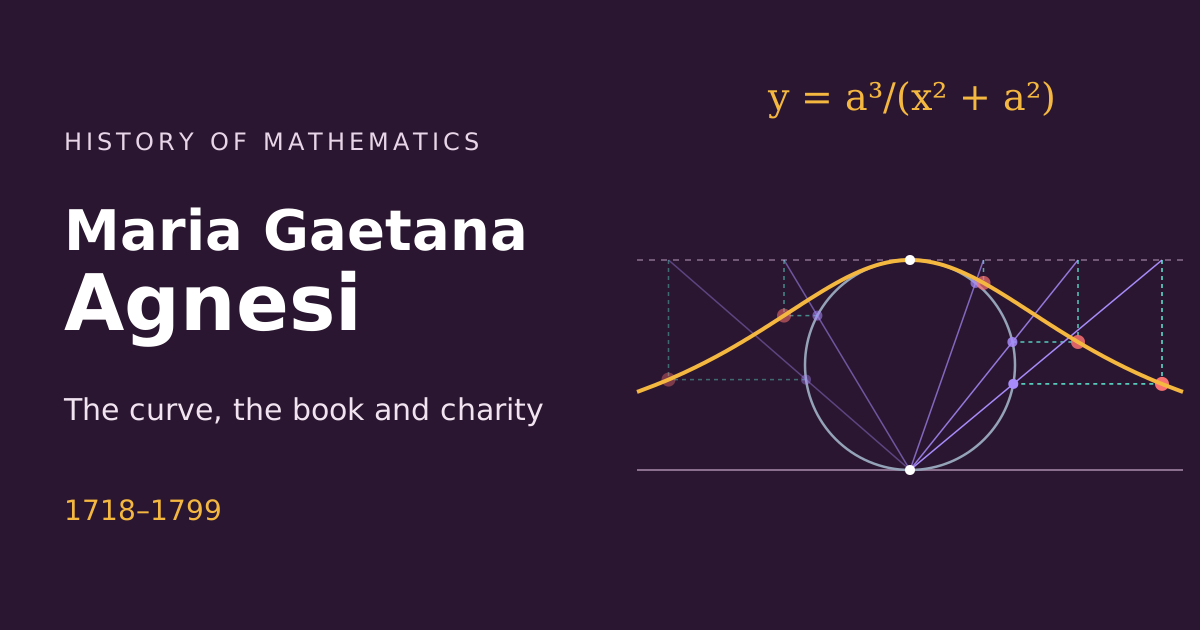
Agnesi died in 1799 without imagining that her curve would have a second life, far from geometry. In the nineteenth century it reappeared in probability theory, as one of the most treacherous examples in statistics. A probability density We saw in The area under the curve that the total area under $y = \frac{1}{1 + x^2}$ is $\pi$. Dividing by $\pi$, the area becomes 1, and the curve becomes a probability density:
Roll one die: each face has the same chance, and the graph of the probabilities is flat. Roll two and add: the sum 7 is the most likely, and the graph becomes a triangle. Roll ten, thirty, a hundred: the graph of the sum gradually takes the shape of a bell. The same happens if, instead of dice, we add coins, roulette wheels or measurement errors. This surprising fact is the central limit theorem.

A bar chart seems to need no explanation: taller bar, bigger number. In the language of chapter 2, it is an icon: the height resembles the quantity. But behind every chart there is a convention the eye does not read: the scale. And when the convention changes, the icon goes on speaking with the same confidence, now saying something else. The cut axis A company’s sales were $96$, $98$, $101$ and $104$ in four consecutive years. Modest growth: $8.3\%$ in three years. Now draw the bars with the vertical axis starting at $95$ instead of $0$. The first bar has height $1$; the last, height $9$. The last one looks nine times larger than the first.
Until the end of the eighteenth century, numbers were published in tables. A table is exact, but it forces the reader to compare row by row, holding values in their head. The data chart replaces that reading with a glance: differences, trends and peaks appear before a single number is read. Four charts show how this invention changed what could be seen. Playfair invents the line chart England’s exports and imports with Africa, 1700 to 1780, in William Playfair’s Commercial and Political Atlas (1786). The area between the two lines shows the balance of trade.William Playfair · Wikimedia Commons · public domain In 1786 the Scotsman William Playfair, an engineer and pamphleteer with an eventful life, published The Commercial and Political Atlas, with 44 charts on English trade. There, for the first time in a systematic way, appear the line chart with time on the horizontal axis and the bar chart. In 1801 he added the pie chart. Playfair justified the drawings by saying that the eye grasps the shape of a series of numbers far better than memory holds the numbers.